There's nothing more frustrating than loading a website and seeing a blank page with the message 503 Service Unavailable. For your visitors, it's just another broken link in the vast sea of the Internet. But for those of us who own websites, develop them, or manage IT systems, this error can lead to downtime, lost revenue, and a drop in search engine rankings.
Let's take a look at what this status code actually means, why it appears, and how it can be effectively diagnosed and fixed - regardless of whether you're using a simple WordPress site or a Kubernetes cluster.
What is HTTP 503?
The HTTP 503 (Service Unavailable) status code is a server-side error that tells you that the server is temporarily unable to process your request. Unlike 404, which means page not found, or 500, which indicates a more general internal server problem, 503 specifically indicates a temporary overload or maintenance situation.
Simply put, your web server is saying:
“I'm here, but I'm currently overloaded or unavailable. Please try again later.”
The key word here is temporary. This usually means that the problem can be solved if you know where to look.
Common causes of error 503
Unfortunately, there is no single cause for error 503. It is more of a sign that something more serious is happening in your infrastructure. Let's look at some of the most common causes:
- Server overload - when your web server receives more requests than it can handle (perhaps due to a viral post, bot attack, or poorly optimized code), it may start rejecting new connections with a 503 response;
- Maintenance mode - some web applications, such as WordPress, go into maintenance mode during updates. If this mode is not disabled properly, users may see a persistent 503 message;
- Backend or database issues - for dynamic websites (such as those built with Django or Node.js), if the backend or database connection is down, the web server may respond with a 503 error until everything is restored and working;
- Reverse proxy and load balancer timeouts - in configurations using Nginx, HAProxy, or Cloudflare, timeouts between the proxy and the origin server can often cause 503 errors. This is often caused by misconfigured upstreams or backend failures;
- Resource limitations - in virtual hosting or VPS environments, if your account exceeds CPU, memory, or process limits, the hosting system may return a 503 code until resources become available again.
- Container or microservice failures - In Docker or Kubernetes, restarting a pod or a failed deployment can temporarily make the service unavailable. During sequential updates, requests may hit containers that are not ready, leading to a brief spike in 503 errors.
Examples of 503 errors in popular systems
To better understand how HTTP 503 errors manifest themselves, it is useful to consider how they appear in different types of infrastructure - from classic Nginx to Kubernetes and CMS such as WordPress. These examples will help you quickly identify the source of the failure and compare it to your situation.
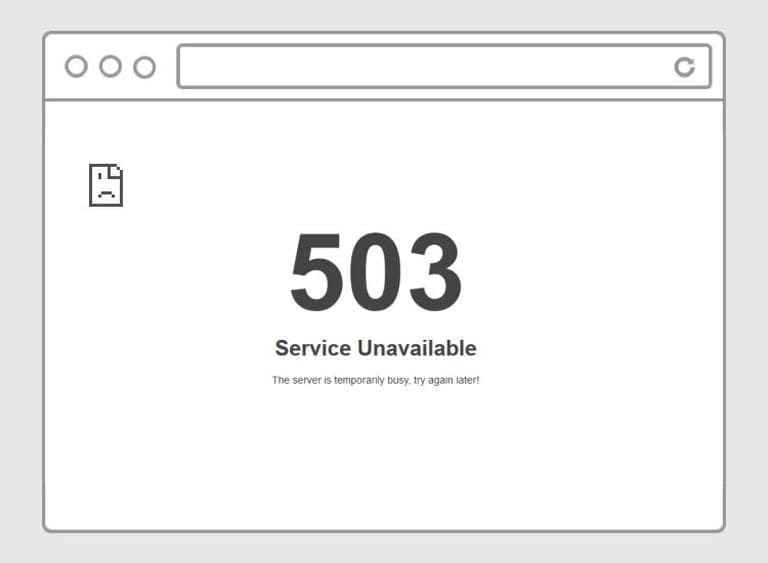
Error 503 in a browser
In most cases, the user sees a concise message:
503 Service Unavailable

The server is temporarily unable to service your request due to maintenance downtime or capacity problems. Please try again later.
If the developer console is enabled (F12 → Network), you can see the header:
Status Code: 503 Service Unavailable

Retry-After: 60
This means that the server is asking the client to repeat the request in a minute.
Example for Nginx
In the error logs /var/log/nginx/error.log, you can usually see the following lines:
2025/11/10 14:12:08 [error] 1532#1532: *1228 upstream timed out (110: Connection timed out) while reading response header from upstream, client: 192.168.0.15, server: example.com, request: “GET / HTTP/1.1”, upstream: “http://127.0.0.1:8000/”, host: “example.com”
Such messages mean that Nginx did not wait for a response from the backend, and the user was returned a 503 code.
Example for WordPress
When updating plugins or the CMS core, WordPress automatically creates a .maintenance file in the root directory of the site. If this file is not deleted after the update is complete, the site remains in maintenance mode, and users see the message:
Briefly unavailable for scheduled maintenance. Check back in a minute.
Delete the .maintenance file to return the site to working condition.
What is .maintenance?
This is a temporary WordPress system file that signals to the engine that the site is in maintenance mode. It is created automatically when updates are installed and should be deleted by the system after they are complete. If the process is interrupted, the file remains and blocks the site.
Example for Kubernetes
In Kubernetes, error 503 often occurs when restarting Pods or when a readiness test fails.
Example output:
$ kubectl get pods

NAME READY STATUS RESTARTS AGE

app-backend-6f8d8b9b4c 0/1 CrashLoopBackOff 5 2m
Until the Pod is ready to accept traffic, Kubernetes Service or Ingress may return 503 Service Unavailable.
Such diagnostic examples allow you to quickly determine where the failure is occurring - at the application, proxy, container, or CMS level - and reduce the time spent searching for the cause.
Diagnosing the problem
Before you start troubleshooting, you need to pinpoint where the problem lies - in the application, web server, or infrastructure itself. A structured and methodical approach will help you avoid pointless log scouring and trial-and-error troubleshooting.
Check monitoring tools and uptime
Use systems such as Prometheus, Grafana, or external uptime monitoring services to determine whether the failure is a one-off incident or part of a more serious problem.
Check server logs
Review your Nginx, Apache, or application logs (e.g., /var/log/nginx/error.log or journalctl -u gunicorn). Specific error messages such as upstream timed out or connection refused can often lead you directly to the source of the problem.
Check load and resource usage
Tools such as top, htop, or docker stats can help you see if your server is overloaded in terms of CPU or memory usage. A sudden spike in these metrics is a clear sign of overload.
Check reverse proxy settings
If you are using Nginx as a reverse proxy, double-check that the proxy_pass destinations are configured correctly and that the backend service is running smoothly.
Disable or reconfigure maintenance mode
In content management systems such as WordPress, if your site is frozen, try deleting the .maintenance file from the root directory.
In the table below, we have compiled the most useful commands for quick diagnostics. They will help you check the status of services, logs, database connection, and network availability.
Table - Useful commands for diagnostics
| Purpose |
Command |
Notes |
| Check web server status |
systemctl status nginx |
Fast way to see if the service is active or failed to start |
| View recent errors |
journalctl -xeu nginx |
Great for systemd services: shows recent log entries with errors |
| Check PHP or Gunicorn status |
systemctl status php-fpm
systemctl status gunicorn |
503 often occurs if backend isn’t running |
| Check resource usage |
htop or top |
Quickly shows CPU and memory overload |
| Test connection timeouts |
curl -I -L https://yourdomain.com |
Displays HTTP headers and status codes, helps detect 503 or redirects |
| Test database availability |
psql -h 127.0.0.1 -U user dbname
mysql -h 127.0.0.1 -u user -p |
Ensures database responds and connections aren’t dropped |
| Check backend network reachability |
telnet 127.0.0.1 8000 or nc -zv 127.0.0.1 8000 |
Useful for debugging “upstream timed out” errors in Nginx |
| View container logs |
docker logs <container_name> --tail 50 |
For applications running in Docker environments |
| Check Pod status |
kubectl get pods -A |
In Kubernetes, helps detect Pods stuck in CrashLoopBackOff state |
Fixing HTTP 503
Now that you've identified the problem, it's time to move from diagnosis to action. The good news is that most 503 errors are not catastrophic - they usually occur due to temporary overloads, configuration failures, or service outages. However, if you leave them unattended, you may experience recurring downtime and visitor dissatisfaction.
In this section, we'll look at several practical steps you can take to restore your website or application to working order - from quick fixes like restarting services to more in-depth optimizations like configuring your web server, scaling your infrastructure, and checking your database health. Each step is designed to help you quickly restore stability and avoid future 503 errors.
1. Restart services
Sometimes the simplest solution works. Restarting web servers and application servers can clear temporary locks or process failures:
sudo systemctl restart nginx

sudo systemctl restart php-fpm

sudo systemctl restart gunicorn
For containerized environments:
docker restart <container_name>
Or in Kubernetes:
kubectl rollout restart deployment <app_name>
2. Scale or optimize resources
If traffic spikes are overloading your server, vertical (adding CPU/RAM) or horizontal (adding nodes) scaling may help.
Tools such as Kubernetes Horizontal Pod Autoscaler (HPA) or AWS Auto Scaling Groups automate this process. Well, if your system is located on a VPS server and it turns out that the server resources are exhausted, you can scale your server by switching to a different plan. Just do this as a last resort, when you are absolutely sure that the problem is indeed insufficient server resources, and not, for example, an unoptimized database query.
3. Check for infinite loops or deadlock situations
Poorly written code can cause your application to enter infinite loops, freezing workflows. Profiling or APM tools (such as Datadog or New Relic) can detect such problems.
4. Fix your database connection
If your backend depends on a database (MySQL, PostgreSQL, MongoDB), make sure it is up and running and accessible. A simple psql or mysql connection test can save hours of guesswork.
5. Check your reverse proxy and firewall rules
Check if your firewall, CDN, or proxy (e.g., Cloudflare) is blocking legitimate requests. Adjust timeouts and buffer sizes in your Nginx configuration if requests are being dropped too early.
For example:
proxy_connect_timeout 60s;

proxy_read_timeout 60s;
6. Disable problematic plugins or extensions
In WordPress, Joomla, or Magento, disable recent plugins that may have caused the problem. Conflicts when updating plugins are a common cause of temporary 503 errors.
7. Plan for maintenance
If you intentionally need downtime, for example, during database migration, use maintenance pages or 503 headers with Retry-After to inform browsers and crawlers. This will prevent so-called SEO penalties.
Preventing HTTP 503 errors in the future
To minimize the likelihood of HTTP 503 (Service Unavailable) errors, especially during peak loads, it is important to plan for the resilience of your infrastructure in advance. Below are proven strategies to help ensure your website or application remains stable even during high traffic.
Load balancing
Distribute incoming traffic across multiple backend servers so that no single node becomes a bottleneck.
Use tools such as Nginx, HAProxy, or cloud load balancers (AWS ELB, Google Cloud Load Balancer).
This will allow the system to automatically redistribute requests when one of the servers fails and avoid overloads that lead to 503 errors.
Caching
Implement caching to reduce the load on the backend.
Tools such as Varnish, Redis, or Cloudflare CDN allow you to store static responses and deliver them to users without involving the application.
Even when servers are overloaded, users will receive cached data without errors.
Monitoring and alerts
Set up monitoring systems such as Prometheus and Grafana to track performance and resource utilization.
Create dashboards and automatic alerts that notify you of increased load or service unavailability before users encounter errors.
Automatic restart
Use process managers - PM2, Supervisor, or systemd - to automatically restart frozen or crashed services.
This will allow services to recover without administrator intervention and reduce downtime.
Regular updates
Keep all components of the stack up to date:
the operating system, web server, CMS, libraries, and plugins.
Outdated versions often contain bugs or vulnerabilities that can lead to unstable performance and 503 errors.
Real-world examples for preventing 503 errors
Example of Nginx configuration for 503 resilience
One of the most effective ways to prevent 503 Service Unavailable errors is to correctly configure timeouts and handle failed requests.
The example below demonstrates how to increase the stability of the Nginx proxy against temporary backend failures:
location / {

proxy_pass http://backend;

proxy_connect_timeout 60s;

proxy_read_timeout 60s;

proxy_send_timeout 60s;
# Repeat the request in case of an error or timeout

proxy_next_upstream error timeout invalid_header http_500 http_502 http_503;

proxy_next_upstream_tries 3;
# Cache responses to reduce load

proxy_cache my_cache;

proxy_cache_valid 200 302 10m;

proxy_cache_valid 404 1m;

}
Example HAProxy configuration for 503 resilience
HAProxy helps to “eat” short-term backend failures and not release 503 to the outside - through health checks, queues, retries, and correct timeouts.
global

maxconn 10000

defaults

mode http

option httplog

retries 2

timeout connect 5s

timeout client 60s

timeout server 60s
frontend fe_http

bind *:80

default_backend be_app
backend be_app

balance roundrobin

option httpchk GET /health

http-check expect status 200

retry-on all-retryable-errors

queue 200

server app1 10.0.0.11:8000 check rise 2 fall 3

server app2 10.0.0.12:8000 check rise 2 fall 3
Preventing 503 errors with CloudFlare
Cloudflare can smooth out short-term server issues and protect users from 503 Service Unavailable errors. For this to work effectively, it is important to configure caching, exceptions, and health checks correctly.
First, configure caching for static and partially static content. To do this, create a Cache Everything rule for publicly accessible pages and files, such as images, styles, and scripts. Exclude dynamic sections from caching - the admin panel, personal account, and any pages where users log in. If necessary, you can add the “Bypass cache on cookie” condition to bypass the cache if there are authorization cookies such as wp_logged_in_.
On the server (origin), use correct HTTP headers so that Cloudflare can cache data optimally. For example, setting Cache-Control with the parameters s-maxage, stale-while-revalidate, and stale-if-error allows the CDN to serve users an old version of the page if the server is temporarily unavailable and update it in the background without causing 503 errors.
Second, avoid false 503 errors, which can be caused by Under Attack mode being enabled or overly strict WAF rules. Add exceptions to Firewall Rules for safe traffic sources - monitoring systems, webhooks, and API requests. For critical paths, configure separate rules with Bypass Security Level and Bypass Cache parameters so that Cloudflare does not interrupt the connection.
If you are using Cloudflare Load Balancer, be sure to enable health checks for your servers. If one of the nodes fails, traffic will be automatically redirected to healthy servers, preventing a mass occurrence of 503 errors.
Finally, optimize your application's response time: use queues, connection pools, fast health endpoints, and background tasks for long operations. This will reduce the load on the origin and decrease the likelihood of errors at the CDN level.
The main rule is to cache wisely. Static content can be stored for a long time and delivered instantly, while dynamic pages and admin interfaces should always access the server directly to keep the data up to date.
Conclusion
HTTP 503 (Service Unavailable) is not the end of the world! Think of it more as a flashing warning light on your server's control panel. It's a signal that your infrastructure is overloaded - or perhaps just taking a short break to update.
By learning all the ins and outs of configuring your application or website and troubleshooting step by step - from analyzing logs to scaling when necessary - you can turn these unpleasant downtimes into valuable lessons that will strengthen your systems.
Whether you run a small, cozy blog on a shared server or control a growing Kubernetes cluster with auto-scaling microservices, understanding the essence of a 503 error is key to ensuring the reliability, stability, and professionalism of your online presence - just as your users expect.