An HTTP 504 error is one of those things that frustrates both users and the people on the server side alike. The site seems to be up and running, the server is responding, the network hasn’t gone down, and even the application usually keeps working. But at some point, the request seems to “get stuck” inside the infrastructure - and instead of the requested page, the user gets a cold “Gateway Timeout”.
And here’s what’s particularly annoying: a 504 error almost never tells you exactly where the problem lies. Did the backend go down, did an SQL query hang, is some external API taking 40 seconds to respond, did Nginx overload, or did Cloudflare simply not wait for a response? Sometimes the cause might even lie between data centers, while the site itself looks perfectly functional.
Because of this, 504 is considered one of the most ambiguous infrastructure errors. A 500 error at least hints that the application has crashed. A 404 honestly tells you that the page doesn’t exist. But here, everything looks “almost normal” - and that’s exactly the point: it’s almost.
These errors often pop up under high load. For example, an online store during a sale or a WordPress site with a dozen heavy plugins. Or a backend running on Docker containers that suddenly starts hitting CPU or disk limits. And things can get even more chaotic when a single slow database query starts building up a queue of other requests, causing timeouts to spread throughout the entire system.
And yes - a 504 error is almost always a sign of a problem, but it’s never the problem itself. It simply means that there’s already a bottleneck somewhere within the infrastructure, but the browser just sees a timeout.
In this article, let’s try to figure out what happens when an HTTP 504 appears, where to look for such errors first, and how to diagnose these kinds of freezes in a normal infrastructure.
What does a 504 error mean
An HTTP 504 appears when one server waits too long for a response from another. At some point, the wait ends and a “Gateway Timeout” response is sent out.
Usually, the issue isn’t with the website itself, but with an intermediary component, such as Nginx, Cloudflare, a Load Balancer, Kubernetes Ingress, or an API Gateway. After all, the user interacts with these components, and they are the ones trying to reach the backend application.
The architecture of most applications usually looks something like this:
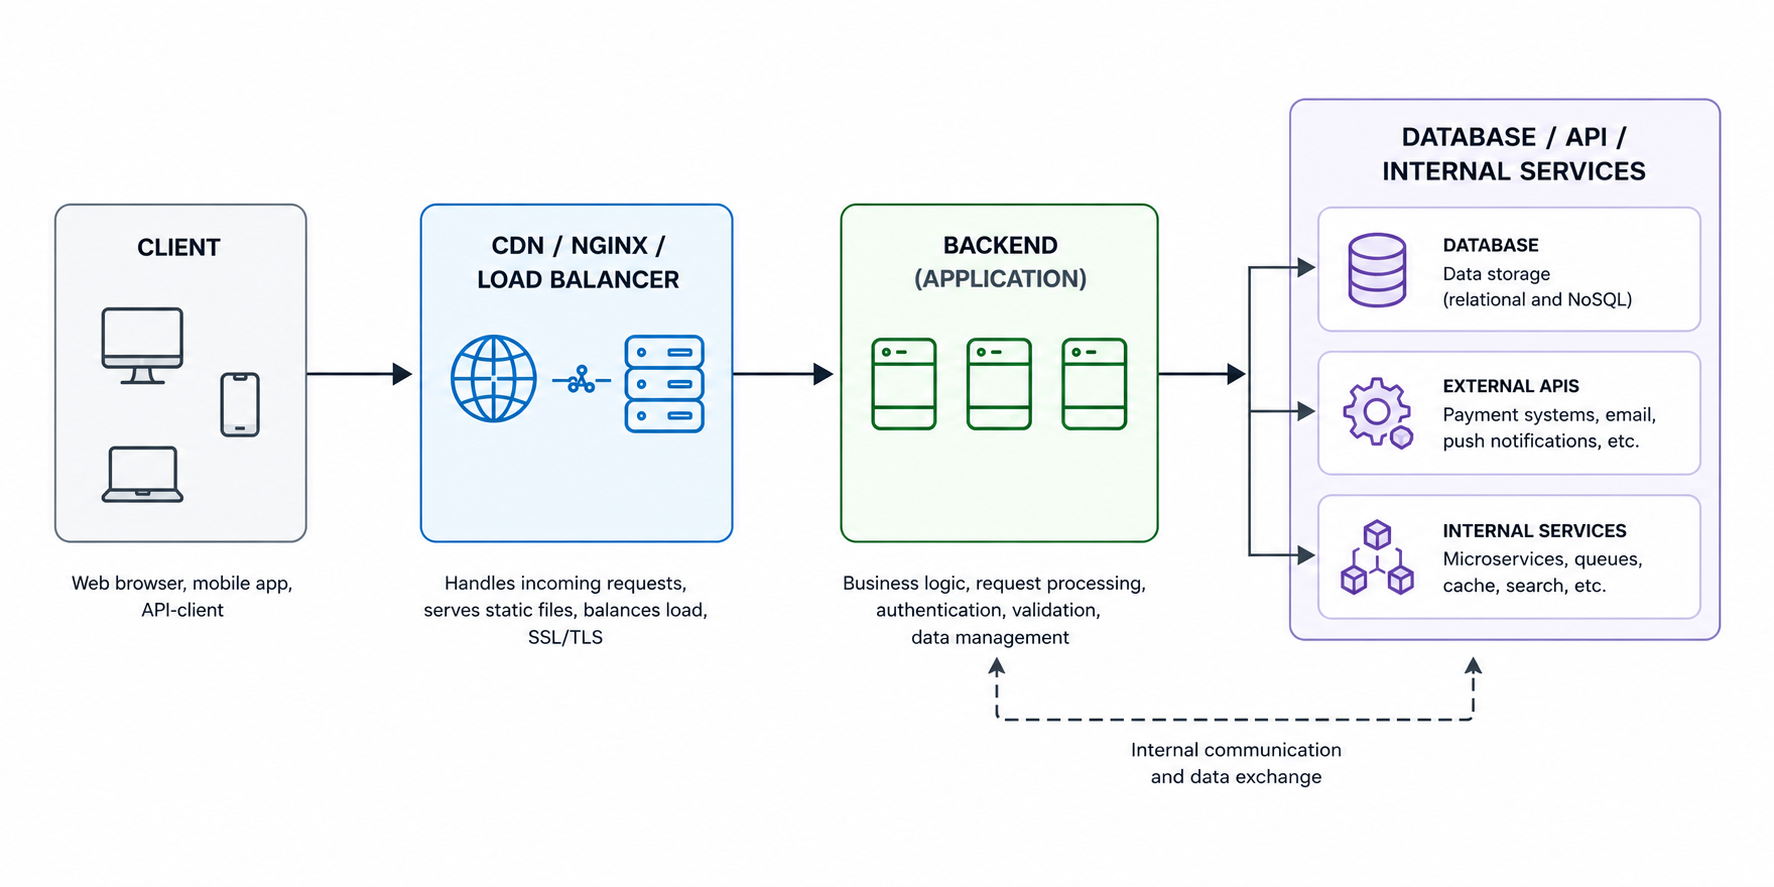
And this is where things get interesting. The user only sees the final error, but the real cause may lie deep within the chain, sometimes in the most unexpected place.
For example, Nginx sent a request to Gunicorn, and the Python application hung on a heavy SQL query. Or Cloudflare is patiently waiting for the origin server, which at that moment hit a CPU bottleneck and started taking 40 seconds to respond. In Kubernetes, a similar scenario occurs with Pods: the Ingress works fine, the containers are alive, the readiness checks are green, yet a single service inside is still slowing down the entire chain.
A separate category of pain points involves external APIs, especially payment gateways, various CRMs, and other components that developers don’t control directly. A single slow external request, and the timeout starts spreading further through the infrastructure.
As a result, the frontend server simply stops waiting. Not because “everything went down”, but because the timeout simply expired.
That’s why diagnosing a 504 error rarely comes down to checking a single Nginx config; you have to look at everything at once: the backend, the database, Docker containers, the network between nodes, task queues, Redis, external APIs, and who knows what else. And it often happens that the problem is found where you least expected it - for example, in DNS queries or slow network storage.
What a 504 error looks like in different systems
An HTTP 504 error doesn’t always look the same. It all depends on which component in the chain of dependencies “gave up” first, since the same frozen backend can trigger completely different error messages, which regularly confuses even experienced administrators.
Here are some typical examples:
| System | How the error appears |
|---|---|
| Nginx | 504 Gateway Timeout |
| Cloudflare | Error 504 |
| Kubernetes Ingress | upstream request timeout |
| AWS Load Balancer | Gateway Timeout |
| PHP-FPM | upstream timed out |
| Gunicorn | WORKER TIMEOUT |
It bears repeating that the component displaying the error is not necessarily the source of the failure; it simply happened to be the first in the chain to stop waiting for a response.
For example, Cloudflare shows Error 504 - so the CDN is to blame. Makes sense? It does. But the problem might actually lie with PostgreSQL, which takes 25 seconds to respond to a single query.
With Kubernetes, this is especially amusing. DevOps increases the timeout in Ingress, the error temporarily disappears, and everyone is happy... But not for long, because a week later the site starts to slow down again. And all because the containers were hitting disk or CPU limits the whole time, and the timeout was simply masking the real problem.
Generally, a 504 often acts as a signal like “where patience runs out” - nothing more.
Main causes of a 504 error
As we’ve already seen, while the HTTP 504 error almost always looks the same, there can be a multitude of reasons for its occurrence. Sometimes it really does come down to a simple timeout in Nginx. But more often than not, an HTTP 504 is the final symptom that one of the components within the infrastructure has been operating at its limit for a long time - it’s just that it’s only now become apparent.
There are several scenarios that come up all the time.
Slow backend
The most common cause is that the backend takes too long to process a request.
And the problem here isn’t always a weak server. Even a normal infrastructure can start throwing 504 errors if the application is doing something resource-intensive right in the middle of an HTTP request, such as exporting to Excel.
Let’s list some typical situations: Sometimes everything works for months without a single error, and then users suddenly start downloading annual reports en masse. As a result, the Gunicorn worker freezes for 40-50 seconds, the queue grows, Nginx stops waiting for a response, and hello, 504 error.
- heavy SQL query;
- calling an external API;
- generating a PDF or archive on the fly;
- synchronous processing of large volumes of data;
- lack of CPU or RAM.
It’s a similar story with payment APIs. The user clicks the payment button, the backend calls an external service, and that service takes too long to respond. So, the site is technically still up, but the client is already seeing a “Gateway Timeout” error.
Proxy-level timeouts
There’s another scenario where the backend manages to process the request, but the proxy simply doesn’t want to wait that long.
Nginx, Cloudflare, API Gateway, and various load balancers - they all have their own pre-set wait limits. And if the backend takes a little longer than expected, the connection times out prematurely.
In Nginx, this is usually controlled by directives such as: Let’s say the application takes 70 seconds to respond, and proxy_read_timeout is set to 60. This means that on the 61st second, Nginx will return a 504, even if the backend has almost finished processing.
proxy_read_timeoutfastcgi_read_timeoutproxy_connect_timeoutproxy_send_timeout
Because of this, many people start endlessly increasing the timeout. Sometimes this actually helps, but more often it just makes the freezes even longer and more agonizing. You need to address the root cause of the timeout.
Network issues
HTTP 504 errors can easily occur even in applications with absolutely no errors in the code or infrastructure.
This happens particularly often in infrastructures where the architecture includes a multitude of intermediate layers, such as CDNs, Kubernetes, VPNs, multiple data centers, external APIs, microservices, and so on. Under such conditions, even a minor network degradation is enough for timeouts to start piling up.
The causes can vary widely, since networking is a vast topic in itself. But the most common causes of 504 errors are: It’s frustrating that the server may appear to be fully operational on the surface - SSH connects, and ping works. Yet HTTP requests periodically hang for 20-30 seconds and eventually time out. That’s why the phrase “the server is pingable” almost never proves anything.
- packet loss;
- overloaded uplink;
- unstable routing;
- firewall rules;
- peering issues between providers;
- CDN limitations.
Server overload
Perhaps the most common reason is when the server is struggling - it hasn’t completely crashed yet, but it’s already choking under the load. CPU is hovering at 100%, memory is almost gone, swap starts hammering the disk, I/O wait times are rising, and eventually the backend can no longer keep up with processing requests.
On a VPS, this usually manifests quite distinctly - the site starts loading intermittently or SSH begins to freeze up.
Swap is a whole other headache, because when Linux starts actively swapping memory to disk, the backend can slow down significantly, especially on cheap VPSs with slow storage. Again, technically the application keeps running, but in reality the infrastructure can no longer handle the load.
Database Issues
One of the most underestimated causes of a 504 error is the database.
And yet, the backend may be completely functional, and nothing has changed in either the code or the project architecture. It’s just that PostgreSQL or MySQL suddenly start responding much slower than before.
In such cases, the following factors are usually to blame:
- lack of indexes;
- heavy JOINs;
- table locks;
- inefficient SQL from the ORM;
- an overloaded connection pool.
DDoS, bots, and traffic spikes
Finally, there are cases where the infrastructure breaks down not from within, but from outside. And this is far from always a full-scale DDoS. A few aggressive bots, a crawler storm, or a sudden influx of users following a post on Reddit or social media is enough.
At some point, the server hits its limits: As you can see, in this case, several symptoms described in the previous subsections immediately appear.
- worker connections run out;
- the backend can’t keep up with keepalive connections;
- the request queue grows;
- CPU and memory hit their limits;
- some requests start timing out.
This can be particularly noticeable on small VPS servers. Just a couple hundred concurrent connections are enough for the application to start behaving as if it’s under attack, even though the traffic may technically be perfectly “legitimate”.
Diagnosing HTTP 504 Errors
The most common mistake administrators make when an HTTP 504 error appears is to panic. The administrator starts tweaking timeouts, restarting containers, and blindly rewriting configurations. Sometimes this even helps, but unfortunately, it’s either short-lived or can lead to a more widespread system failure.
We already know that a 504 error almost never directly reveals the source of the problem. The error appears in one place, while the real cause may lie in a completely different layer of the infrastructure. Therefore, the most critical task is precisely diagnosing and pinpointing the problem.
Below, we’ve outlined a basic diagnostic workflow that applies to most infrastructures, since all modern applications and systems are built in roughly the same way using the same components.
Checking Web Server Logs
It’s always a good idea to start troubleshooting by reviewing logs, preferably those from the reverse proxy - most often Nginx. That’s where the first useful clue usually appears, which can point to the actual cause of the problem.
To begin, let’s look at the error log:
tail -f /var/log/nginx/error.log
Very often, something like this appears there:
upstream timed out (110: Connection timed out)
This is already a great clue from which we can see that Nginx was unable to wait for a response from the backend.
Next, it’s worth checking the access.log:
tail -f /var/log/nginx/access.log
We’ll be particularly interested in fields like request_time and upstream_response_time. If these values suddenly start increasing from milliseconds to tens of seconds, the problem is almost certainly within the backend or the database.
Sometimes this is enough to immediately understand the direction of the investigation. Especially when it’s clear that the timeout occurs only on specific URLs or API methods.
Accessing the backend directly
The next logical step is to remove the proxy from the chain and test the application directly. That is, not through Nginx, Cloudflare, or a load balancer, but directly to the backend. This is easily done with a simple curl request:
For example:
curl http://127.0.0.1:8000
or:
curl http://backend_container:3000
If the backend responds quickly when accessed directly, but a 504 error appears when going through the proxy, then it’s clear that the problem lies somewhere in between - for example, a timeout, network issue, proxy settings, CDN, or load balancer.
If the backend freezes even when accessed directly, then you need to look within the application itself.
By the way, there’s one caveat when working through Cloudflare. Sometimes it’s helpful to temporarily disable proxy mode and go directly to the origin server. This quickly shows whether the problem is related to the CDN or if the server itself can’t handle the load.
Checking the backend’s status
If the problem is indeed with the backend server itself, then we’ll take a closer look at it specifically.
It doesn’t matter what you’re using - Gunicorn, Node.js, PHP-FPM, uWSGI, or Java services - the logic is always roughly the same. First, you need to determine whether the server is overloaded or not, i.e., we start by checking the hardware itself.
Usually, you start with commands like:
top
or:
htop
Here’s what we need to look at: As we mentioned earlier, swap is particularly telling here, because if Linux has started actively swapping memory to disk, performance can drop critically even without a complete server crash.
- load average;
- RAM usage;
- swap;
- I/O wait;
- number of backend processes;
- stalled workers.
Checking the database
Since virtually no application or website can function without a database, it’s worth checking it as well, as it is often the root cause of the problem.
In PostgreSQL, the first thing to check is usually:
SELECT * FROM pg_stat_activity;
The following look particularly suspicious:
- long-running queries;
- locks;
idle in transaction;- heavy JOINs;
- sequential scan;
- extremely long execution time.
Network Check
And finally, sometimes the backend can be completely fine, as can the database. But the problem lies in the network. That’s why we always diagnose the network as well.
To start, we usually check:
ping
traceroute
mtr
Then we look at firewall rules, security groups, NAT, VPN, CDN routing, and MTU. Yes, MTU can also sometimes make an administrator’s life miserable in the most absurd ways.
How to fix HTTP error 504
The way to fix HTTP 504 always depends on exactly where the problem was located. Sometimes a single adjustment to the timeout is enough, and sometimes it turns out that the backend has been operating at its limit for a long time - the problem has just finally become noticeable to users.
Unfortunately, there is no “magic pill” to “cure” a 504 error, especially if the infrastructure is already overloaded. So let’s go over a few things that might be helpful in this case.
Increasing the timeout
The first thing people usually do when a 504 error occurs is to increase the timeout.
And sometimes this is indeed justified, particularly if the backend is performing a heavy but legitimate task, such as compiling a large Excel report, generating a large archive, rendering a video, or calculating complex analytics.
In Nginx, people usually look at these directives in the configuration file:
proxy_read_timeout 120;
proxy_connect_timeout 60;
proxy_send_timeout 120;
For PHP-FPM:
request_terminate_timeout = 120
But the problem is that a timeout can very easily become a crutch, as we mentioned earlier.
If the backend is already struggling under the load, increasing the timeout simply forces the user to wait longer for the page to load. Moreover, slow requests continue to keep workers busy, the queue grows, and the server starts to fall apart even faster.
Therefore, increasing the timeout is more of a temporary measure that can sometimes be helpful, but in many cases can do more harm than good. But at least it’s worth knowing about this option.
Backend Optimization
In real production systems, the backend is most often the primary source of 504 errors, and the reason for this is the application’s attempt to perform too much heavy lifting within a single HTTP request.
Classic examples of such tasks include: And while the backend is handling all of this, the worker remains busy, resulting in new requests piling up in the queue. And over time, timeouts start spreading throughout the system.
- PDF or Excel generation;
- exporting large tables;
- heavy SQL queries;
- image processing;
- synchronous calls to external APIs.
In such cases, the following usually helps: For example, instead of generating a PDF directly within the request, the backend can simply create a task in the queue and immediately return the processing status to the user. The document will be generated separately, without blocking the workers.
- offloading heavy tasks to a queue;
- Celery, RQ, BullMQ, and similar systems;
- SQL optimization;
- adding indexes;
- Redis caching;
- Pagination;
- Reducing the number of ORM queries;
- Avoiding synchronous API calls.
- Etc.
After such changes, the application usually starts running not only faster but also much more stably under load.
Infrastructure Scaling
Sometimes the problem really does lie with the server’s resources. This happens especially often on VPS servers that run at the limit of their allocated resources for months on end, until one day there’s just a bit more traffic than usual. After that, random timeouts, SSH freezes, and strange lags throughout the system begin.
In such cases, here’s what helps (your go-to): We don’t see the point in discussing this topic further, since everything is obvious here.
- add CPU;
- increase RAM;
- switch to NVMe;
- distribute the backend across multiple instances;
- set up a load balancer.
Configuring keepalive and connection limits
It also happens that the CPU is free, the database is up, but timeouts still occur. In this case, the cause may lie in network connections, such as when the backend can’t handle a large number of keepalive sessions or Nginx hits the worker_connections limit.
Usually, in this case, you check settings such as:
keepalive_timeout 65;
and:
worker_connections 4096;
Then you check the system limits:
ulimit -n
If the server runs out of file descriptors, new connections start to hang completely randomly. This is particularly problematic during a crawler storm or L7 DDoS, when the server appears to be alive but some requests suddenly time out.
Which metrics to monitor to prevent 504 errors
Until recently, we assumed that the need for system monitoring was self-evident and a given. After all, in most cases, an HTTP 504 doesn’t appear suddenly; usually, the system starts to degrade gradually beforehand. But it turns out that, in practice, a great many projects neglect monitoring. This is especially true for so-called “vibecoders” in their “vibecode projects”, who don’t even give this issue a second thought.
Remember, monitoring is one of the most important tools for preventing any issues in the system, including the HTTP 504 Gateway Timeout. It allows you to spot a problem before users start seeing errors and reporting them to you via tickets or emails.
For production infrastructure, the following metrics are typically monitored:
| What to monitor | Why it matters | Tools |
|---|---|---|
| CPU Load | backend cannot process requests fast enough | Prometheus, Netdata, Grafana |
| RAM and Swap | lack of memory severely slows down backend | Netdata, node_exporter |
| Disk I/O | database and backend are waiting for disk operations | iostat, Prometheus |
| Request Latency | application response time is increasing | Grafana, OpenTelemetry |
| SQL Query Time | slow queries delay backend responses | PostgreSQL Exporter, pg_stat_activity |
| Active Connections | server becomes overloaded with connections | Nginx Exporter, Netstat |
| Error Rate | backend starts returning more errors | Sentry, Loki |
| Queue Size | background tasks cannot be processed fast enough | Celery Exporter, BullMQ metrics |
In small projects, the Netdata + Grafana combination is often sufficient, while in more complex infrastructures, Prometheus, Loki, and OpenTelemetry are typically used. But this is all a matter of preference, and the specific stack naturally depends on your needs, tasks, and your personal skills as an administrator.
FAQ: HTTP 504 Gateway Timeout
How does a 504 differ from a 502?
A 502 Bad Gateway means that the backend returned an invalid response. A 504 Gateway Timeout means that the backend did not respond in time.
Can the database cause a 504?
Yes. This is one of the most common causes, as long SQL queries and locks quickly lead to a backend timeout.
Does increasing proxy_read_timeouthelp?
Sometimes - yes, but if the backend is overloaded, this is only a temporary fix.
Can Cloudflare cause a 504?
Sometimes, but more often Cloudflare simply reflects an issue with the origin server.
Why does a 504 occur under load?
The backend can no longer keep up with requests due to a lack of CPU, RAM, slow SQL, or high I/O wait.
Can Docker or Kubernetes cause a 504?
Yes, they can. The main causes here are ingress timeouts, an overloaded Pod, a restart loop, or a frozen container.
Conclusion
HTTP 504 Gateway Timeout is one of those errors that almost never occurs “just like that” . Usually, it’s a symptom of a deeper problem, such as the backend struggling to handle the load, the database responding too slowly, the network starting to drop packets, containers hitting resource limits, or the application performing overly heavy operations directly within the request.
And the most frustrating part is that the location where the error appears often doesn’t match its source at all.
Often, the user sees a Cloudflare page, the administrator observes a timeout in Nginx, and the backend logs a WORKER TIMEOUT. But in reality, the problem may all along have been a single SQL query that suddenly started taking 20 seconds to execute.
Because of this, diagnosing a 504 error almost always requires looking at the entire infrastructure.
In a classic production infrastructure, HTTP 504 rarely appears completely out of the blue; warning signs usually start flashing beforehand, such as increased latency, slow SQL responses, a rise in load average, and so on. It’s just that many people only notice the problem when users are already seeing a Gateway Timeout.
Therefore, good monitoring and sound architecture often prevent a 504 error from occurring before it even reaches the browser.