


Rebooting a server is an operation that administrators generally try to perform as infrequently as possible, yet sometimes it’s unavoidable. Yes, the procedure isn’t complicated and is often fairly harmless. However, if after reboot the machine doesn’t come back online for several minutes, this can cause some pretty serious problems. You have to admit, it’s not a great feeling when you decide to "quickly" reboot the server, but instead end up with a few minutes of heart-pounding anxiety and a couple dozen gray hairs.
At the same time, a slow boot of a Linux server doesn’t always mean a lack of CPU resources or a slow disk. The server might even have an NVMe drive and a fast enough CPU, yet still lose a minute because of a single service waiting for the network, a nonexistent device, or a file system.
That’s why optimizing the Linux boot process often becomes a necessity. And you shouldn’t start by disabling everything indiscriminately, but rather by measuring specific metrics that will show at which stage the delay occurs.
In short, an extra 30-60 seconds during server boot quickly becomes a significant problem, which we’ll try to resolve in this article.
The Linux Boot Process
To put it very simply, the Linux boot process goes through several sequential stages:
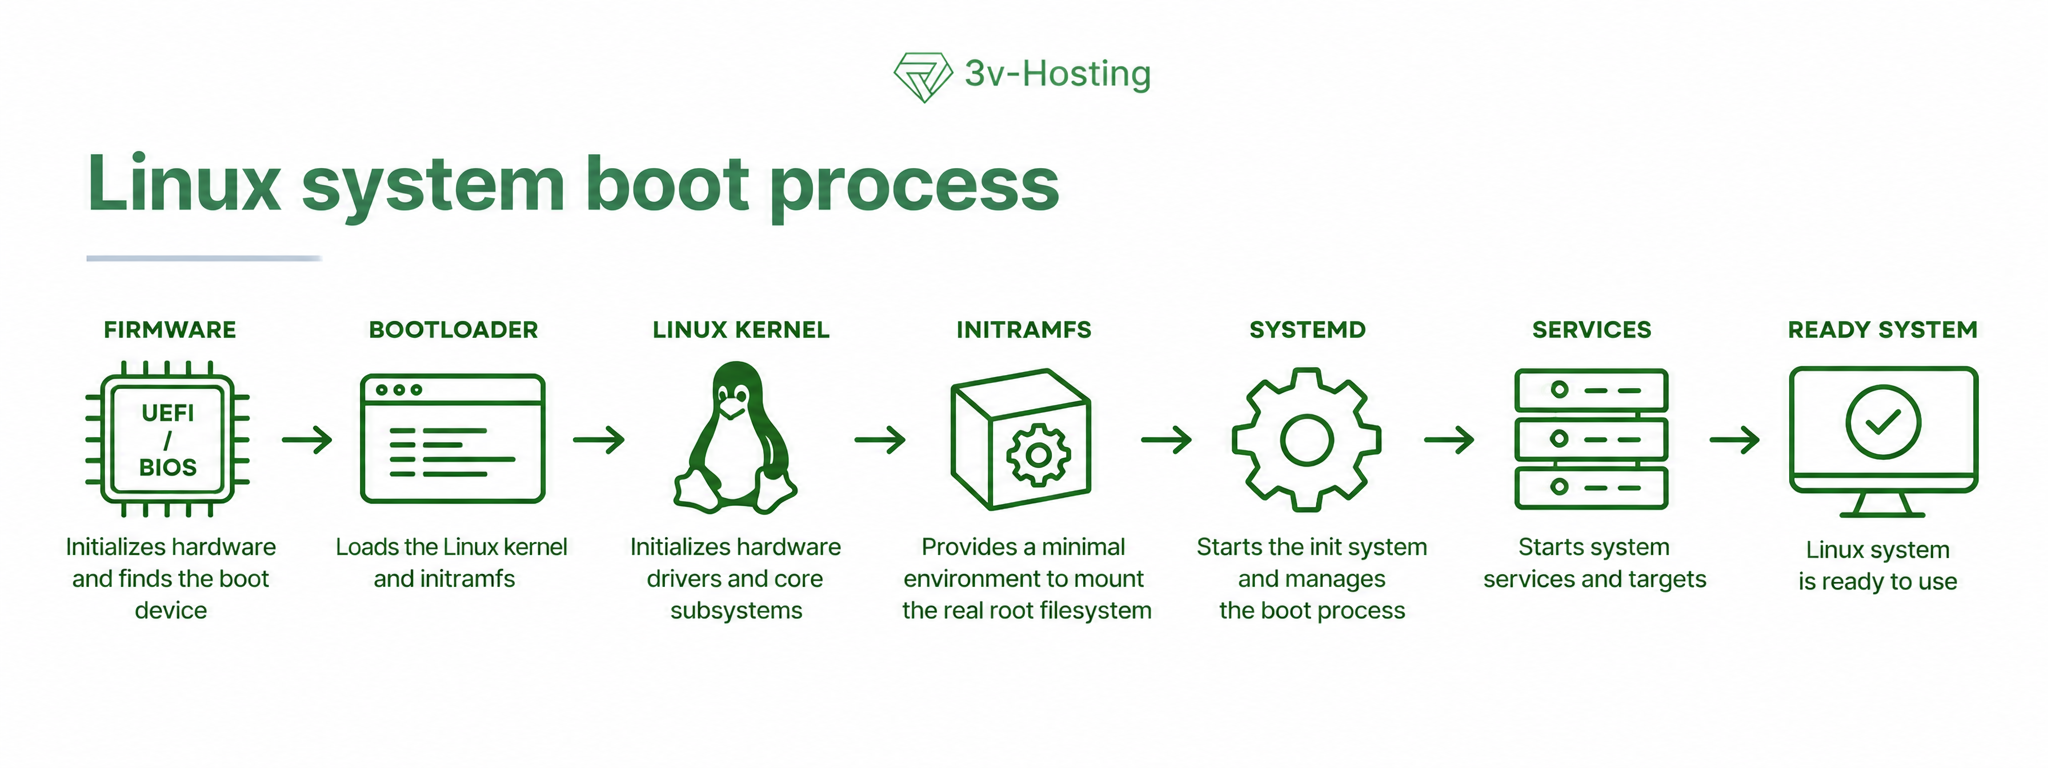
First, the BIOS or UEFI initializes the hardware and hands control over to the boot loader, usually GRUB. The boot loader loads the Linux kernel and initramfs into memory. The kernel starts up, initializes the main subsystems, and loads the drivers available at this stage.
Next, the initramfs - a kind of temporary minimal environment - takes over, helping to prepare the system to work with the actual root filesystem. Here, additional modules may be loaded, disks detected, RAID arrays assembled, or encrypted partitions mounted. After the root filesystem is mounted, control is handed over to systemd.
On a physical server, the time spent on BIOS/UEFI and hardware initialization can account for a significant portion of the entire boot process. On a VPS, this stage depends partly on the hypervisor and usually takes place outside the guest Linux system itself.
Next, systemdstarts system services and brings the system to the desired state (targets). Moreover, services are not lined up in a single long queue; if dependencies allow, several tasks are executed in parallel. Therefore, a service with a startup time of 15 seconds does not necessarily delay the system’s readiness by those same 15 seconds.
This part of the boot process is best analyzed using a tool like systemd-analyze. Let’s move on to a specific analysis.
First, we measure the boot time
So, it’s best to start the diagnosis with the simplest command:
systemd-analyze
or:
systemd-analyze time
The output will look something like this:
Startup finished in 1.842s (kernel) + 5.731s (userspace) = 7.573s
multi-user.target reached after 5.214s in userspace
systemd-analyze separately shows the time for the kernel, initrd, and userspace, if those stages are present. However, this result shouldn’t be taken literally as the moment when all applications are fully ready. Systemd measures the completion of specific system startup stages, and individual services may still continue initializing afterward.
But even at this stage, you can determine the direction of your future investigation: for example, if the kernel starts in two seconds but userspace takes a minute, it’s obviously pointless to start by tweaking GRUB parameters or building your own kernel, since the problem almost certainly lies higher up in the system.
How to determine at which stage Linux boot is slowing down
Before looking for a specific slow service, you need to understand where time is actually being lost. A delay can occur even before systemdstarts, for example, when the kernel takes a long time to initialize a device, initramfs is trying to find the root filesystem, or the system is waiting for an unavailable disk from /etc/fstab.
There’s also a less obvious scenario where Linux has almost finished booting, SSH is already available, but the application you need doesn’t "come to life" until half a minute later. In this case, the problem lies somewhere higher up the chain - for example, a service is waiting for a database, containers, or the completion of migrations.
Therefore, it’s helpful to first identify the problematic stage and only then analyze individual units. We’ve compiled all the basic tools for this task into a single clear and convenient table. Of course, it’s not exhaustive - nor can it be - but at least you can start with it.
| Where time is lost | Possible cause | What to check |
|---|---|---|
| Kernel | slow initialization of drivers, disks, or virtual devices | dmesg, journalctl -b -k |
| Initramfs / Initrd | LVM, RAID, encryption, waiting for a disk, or searching for the root FS | early boot logs, initramfs configuration |
| Userspace | slow systemd units, dependencies between them | systemd-analyze, systemd-analyze blame |
| Network | DHCP, interface configuration, wait-online delays |
networkctl, NetworkManager, network service logs |
| Mounting | incorrect UUID, missing disk, unavailable network mount | /etc/fstab, lsblk, findmnt |
| Application starts late | waiting for a database, starting containers, application migrations, internal initialization | systemctl status, journalctl -u, application logs |
If the delay is in userspace, you can look at individual systemd units. To start, let’s see which ones took longer to start than the rest using the command:
systemd-analyze blame
On a server with a large number of services, the output grows quickly, so it’s easier to limit it to the first 20 lines right away:
systemd-analyze blame --no-pager | head -20
As a result, you should see an output similar to the following:
21.384s systemd-networkd-wait-online.service
 8.912s mysql.service
 3.421s docker.service
 1.204s ssh.service
Now it’s clear where to look. In this example, systemd-networkd-wait-online.service stands out the most, since it took over 21 seconds to start. But it’s easy to jump to the wrong conclusion here.
systemd-analyze blame shows the startup time for each unit. This time cannot be directly considered the delay of the entire boot process, because systemd runs many independent units in parallel, so while one service waits 21 seconds, others may be starting up right alongside it.
It turns out that disabling the first line from blame does not guarantee at all that the server will boot 21 seconds faster. To find the delays that actually lie on the path to a fully booted system, you need to examine the dependencies and the critical boot chain.
Finding the Critical Chain
The systemd-analyze blame command effectively highlights slow units, but this isn’t enough for diagnosing Linux boot issues. We’re interested in a different question: which of these delays actually affect the time it takes for the system to reach the desired state?
There’s a separate command for this:
systemd-analyze critical-chain
It shows the critical boot chain - that is, the sequence of units whose startup times are linked by dependencies and affect the achievement of the selected target.
A sample output might look like this:
multi-user.target @18.921s
└─docker.service @12.412s +6.401s
  └─network-online.target @12.390s    └─systemd-networkd-wait-online.service @2.341s +10.032s
Here we already have a concrete trail. docker.service is waiting for network-online.target, which is only reached after systemd-networkd-wait-online.service has completed. In our example, the latter is activated after about ten seconds.
This results in a chain that can be analyzed from top to bottom. Instead of a long list of slow services, we see interconnected units and can pinpoint where the delay is actually propagating further into the boot process.
However, critical-chain should not be interpreted as a complete boot graph. This command shows the time-critical dependency branch, but in parallel with it, systemd can perform many other tasks. This is usually sufficient for an initial search for a bottleneck.
How to check why a specific systemd service is starting late
Let’s say a suspicious unit has been found, and now you need to figure out what’s going on with it: when it starts, how long activation takes, and which other units it depends on.
The easiest place to start is with the status:
systemctl status docker.service
Here you can see the service’s current status, its startup time, and the latest log messages. If there isn’t enough information, you can view all the unit’s properties:
systemctl show docker.service
The next step is to check the dependencies:
systemctl list-dependencies docker.service
This command will show the units associated with the startup of the selected service, but sometimes it’s more useful to look in the opposite direction:
systemctl list-dependencies --reverse docker.service
This lets you see which units depend on docker.service. This is especially helpful when the service itself takes a long time to start and you want to understand exactly what’s causing the delay.
The mere fact that a unit took ten or twenty seconds is not enough, since you need to find the reason for the delay and understand its place in the boot chain. Sometimes the problem may indeed lie within the service itself, but sometimes it’s simply waiting in line behind another unit - and that’s where you need to look for the cause.
The Network as the Main Cause of Startup Delays
One of the most common reasons for a Linux server taking a long time to start up is waiting for the network to become available. In the results of systemd-analyze, one of two services usually appears:
systemd-networkd-wait-online.service
or, if the network is managed via NetworkManager:
NetworkManager-wait-online.service
The logic behind them is simple. systemd may consider the basic network configuration complete before the target interface actually obtains an IP address and the connection becomes operational. wait-online delays reaching network-online.target until the specified network conditions are met.
This delay is necessary for some systems; for example, a network file resource might be required during boot, and a particular service may only start properly once a working connection is established. But on a standard VPS, these few seconds of waiting are sometimes completely unnecessary.
Problems arise when the expected network state is delayed: DHCP isn’t responding, the configuration still lists an old interface, or an additional NIC is disabled - as a result, the system continues to wait until the condition is met or the timeout expires.
To check for this specific scenario, let’s first see what network-online.target depends on:
systemctl list-dependencies network-online.target
You can check the current status of interfaces when using systemd-networkd as follows:
networkctl
It’s also helpful to immediately verify with standard network commands:
ip addr
ip route
And if the server uses NetworkManager, then check the devices and saved connections:
nmcli device status
nmcli connection show
There are various reasons why "wait-online" might delay boot by tens of seconds, and some of them are easy to overlook after a quick glance at the network configuration. For example:
- an interface that no longer exists remains in the configuration;
- the interface is not receiving a carrier signal;
- the DHCP server takes too long to respond or is completely unavailable;
- an old network profile is attempting to activate automatically;
- the system is waiting for IPv4 or IPv6 configuration;
- an additional network interface is considered mandatory;
- a service requires
network-online.target, even though it can run without waiting for the network to be fully ready.
The last case is particularly frustrating: the network itself may be working perfectly fine, but a single unnecessary dependency forces the boot process to wait for network-online.target.
Therefore, the following command can eliminate the delay:
systemctl disable systemd-networkd-wait-online.service
But don’t apply this blindly! After disabling it, the server may indeed start booting faster, but a dependent service might acquire network connectivity later than expected. As a result, the problem will simply shift from the boot phase to the log of that service.
First, it’s best to figure out who actually needs network-online.target. To view dependencies in reverse, use this command:
systemctl list-dependencies --reverse network-online.target
If it turns out that a guaranteed network connection before these services start isn’t required, then it makes sense to review the dependencies or wait-online settings.
When the problem lies not with the service but with a timeout
Sometimes the duration of the delay itself points you in the right direction.
For example, if the boot process freezes for roughly the same amount of time each time - say, about 30, 60, or 90 seconds - you should look for a component that is waiting for an event to occur before a specific timeout expires.
A typical scenario looks like this:
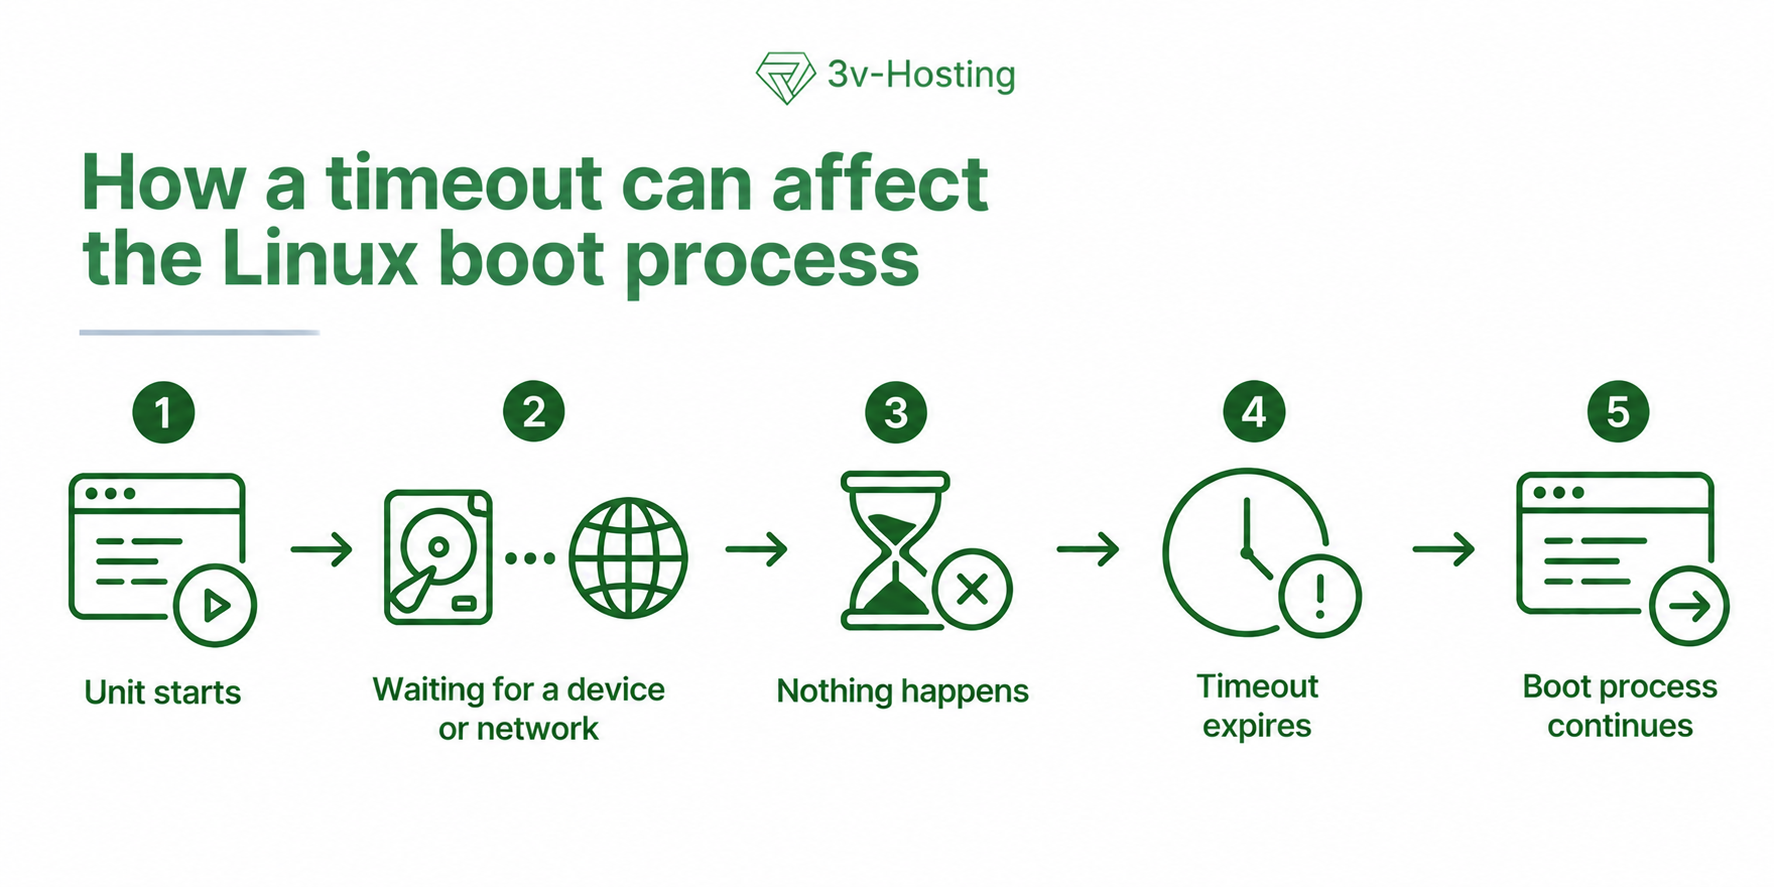
The cause could be a missing or incorrectly mounted disk, an inaccessible network resource, DHCP, an incorrectly configured mount, or a service waiting for some external resource.
This is precisely why, when troubleshooting, it’s helpful to pay attention not only to errors but also to suspiciously recurring time intervals.
Disable Unnecessary Services
After identifying obvious delays, you can examine the set of services that start with the system. In a generic Linux image, there are often services that a specific server simply does not need. This is particularly common in images designed to support multiple installation scenarios at once.
You can get a list of enabled unit files using the command:
systemctl list-unit-files --state=enabled
However, the enabledstatus alone does not indicate whether a service can be disabled. First, check what it does and which units it depends on:
systemctl status service_name
systemctl list-dependencies service_name
Remember that it’s also useful to check dependencies in the opposite direction, as this shows which services rely on this one:
systemctl list-dependencies --reverse service_name
If the service is truly not in use on the server, you can disable its automatic startup:
sudo systemctl disable service_name
However, disable does not prevent the service from starting entirely, and it can still be started manually. In some cases, it may be activated through other systemd mechanisms, such as socket or D-Bus activation.
However, there is a more drastic option for completely disabling the service:
sudo systemctl mask service_name.service
"mask" links the unit to /dev/null, so systemd blocks its normal startup. This is a tool for situations where the service must not start at all. It makes no sense to use it just to save a few hundred milliseconds.
You should also be careful with network services such as SSH, mount units, cloud-init, and virtualization agents. Some of them are only needed during server boot, so after the system starts up, it may mistakenly appear that these services aren’t doing anything at all.
After making all changes, you should reboot the server and run systemd-analyze again, since any optimization only makes sense if the delay has actually disappeared and all necessary services remain operational after the reboot.
Checking for Errors in the Current Boot Process
Sometimes the delay occurs not because a service is slow on its own, but because the system may wait several tens of seconds for a resource that doesn’t even exist. To rule out this possibility, let’s check a few logs:
Let’s start with the general one:
systemctl --failed
After that, it’s worth checking the current boot log:
journalctl -b
To quickly search for warnings and errors, you can use a filter:
journalctl -b -p warning
Here you can find mounting errors, problems with devices, network interfaces, drivers, and services.
If you suspect a specific unit, it’s more convenient to narrow down the log output right away using the same filter:
journalctl -b -u name.service
For example:
journalctl -b -u systemd-networkd-wait-online.service
Obviously, searching for the cause this way is usually easier than manually reviewing the entire boot journal.
Check /etc/fstab and missing disks
A boot delay may be caused by an error made when configuring disks in /etc/fstab. This often happens after changes to the disk configuration, when a device has already been removed or unmounted but the entry for its automatic mounting remains.
For example:
UUID=xxxx /mnt/storage ext4 defaults 0 2
On the next boot, systemd will attempt to find the device with the specified UUID and mount it. But if that disk is no longer present, the system may waste time waiting for it to appear. And sometimes this is precisely the source of suspicious pauses lasting several tens of seconds.
To rule out this possibility, first let’s check the available file systems and their UUIDs using the command:
lsblk -f
You can also verify the UUID using:
blkid
Now let’s check the /etc/fstab file itself:
findmnt --verify
If the fstab file contains a UUID that isn’t among the available devices, this entry should be checked first.
However, it isn’t necessary to delete it right away. For an additional disk whose absence doesn’t interfere with the server’s operation, you can use the nofail option. Then, a mounting error for such a storage device shouldn’t prevent the system from booting successfully.
There are other options as well. For example, x-systemd.automount allows the file system to be mounted the first time it is accessed, and x-systemd.device-timeout= specifies the amount of time systemd will wait for the device to appear.
And for a non-essential archive disk, this configuration may be quite reasonable:
UUID=xxxx /mnt/archive ext4 defaults,nofail,x-systemd.device-timeout=5s 0 2
The situation is slightly different with critical file systems. For example, if a partition contains PostgreSQL or Docker data, masking the availability issue with nofail for the sake of faster server boot is quite risky.
If time is being lost during the kernel phase
Sometimes the delay occurs even before systemd starts. If systemd-analyze shows a significant amount of time spent in the kernel phase, then looking for a slow service is pointless, since the problem clearly lies earlier in the boot chain.
In this case, you can start your search with kernel messages:
dmesg
And for the current boot, the kernel log is useful:
journalctl -b -k
It shows kernel messages only for the current boot. This is especially useful if some of the earlier messages have already disappeared from the kernel ring buffer and the dmesg output is incomplete.
In the log, look for events such as:
- disk initialization errors;
- device timeout messages;
- driver issues;
- firmware boot errors;
- repeated attempts to initialize hardware;
- prolonged detection of disks, controllers, and other storage devices;
- issues with virtual devices;
- unusually long pauses between consecutive messages.
The last point often provides a good clue. A message itself may look perfectly normal, but if the next line appeared 20 seconds later, it’s worth finding out what the kernel was doing during that interval.
You can immediately display messages with timestamps that are easy to compare using the command:
journalctl -b -k -o short-monotonic
This makes it easier to spot where the normal flow of messages is suddenly interrupted by a long pause.
As we briefly mentioned above, the set of possible causes also depends on the type of server. On a VPS, the kernel works with virtual hardware provided by the hypervisor, so some physical issues are hidden from the guest system. On bare metal, however, you have to take into account actual disks, controllers, network cards, firmware, and other hardware.
If the delay is detected here, further troubleshooting usually centers on the messages immediately before and after the temporary interruption.
Initramfs and the kernel: it’s not always worth digging into
As a reminder, initramfs is a temporary file system that the kernel uses during the early stages of boot. It contains the components necessary for preparing and mounting the actual root file system, such as storage device drivers, LVM tools, RAID software modules, or tools for working with encrypted partitions.
However, the composition of initramfs can be optimized. You can remove unnecessary modules, change how it is built, and thereby slightly reduce early boot time. That said, the potential gain here is usually small, and a mistake could result in a system that cannot find the root file system at all after a reboot.
You need to be especially careful when working with servers that use LVM, software RAID, disk encryption, or non-standard storage configurations. In such cases, the contents of the initramfs are directly tied to the system’s ability to boot.
On a typical VPS, it only makes sense to tinker with this for optimization purposes if diagnostics actually indicate a delay during the initramfs phase. Therefore, if systemd-networkd-wait-online takes 25 seconds, while the entire early boot phase takes just a couple of seconds, it’s clearly too early to start rebuilding the initramfs - you should first address the major delays. After all, saving a few hundred milliseconds won’t make much of a difference if, further down the chain, the system is waiting tens of seconds for the network, a disk, or a hung service.
Visualizing Server Boot
Everything described above - all these lists and dependency chains - is useful as long as the number of units remains fairly small. But on a server with dozens of services, the text output quickly becomes overwhelming, and it becomes much harder to grasp the big picture. This is where another feature of the systemd-analyze utility comes in handy - generating a boot timeline.
You can create it with a single command:
systemd-analyze plot > boot.svg
This will generate a file named boot.svg, which you can open in a standard web browser. The diagram breaks down the server’s boot process over time: you can see when each unit starts, how long it takes to activate, and how other units are running during that same period.
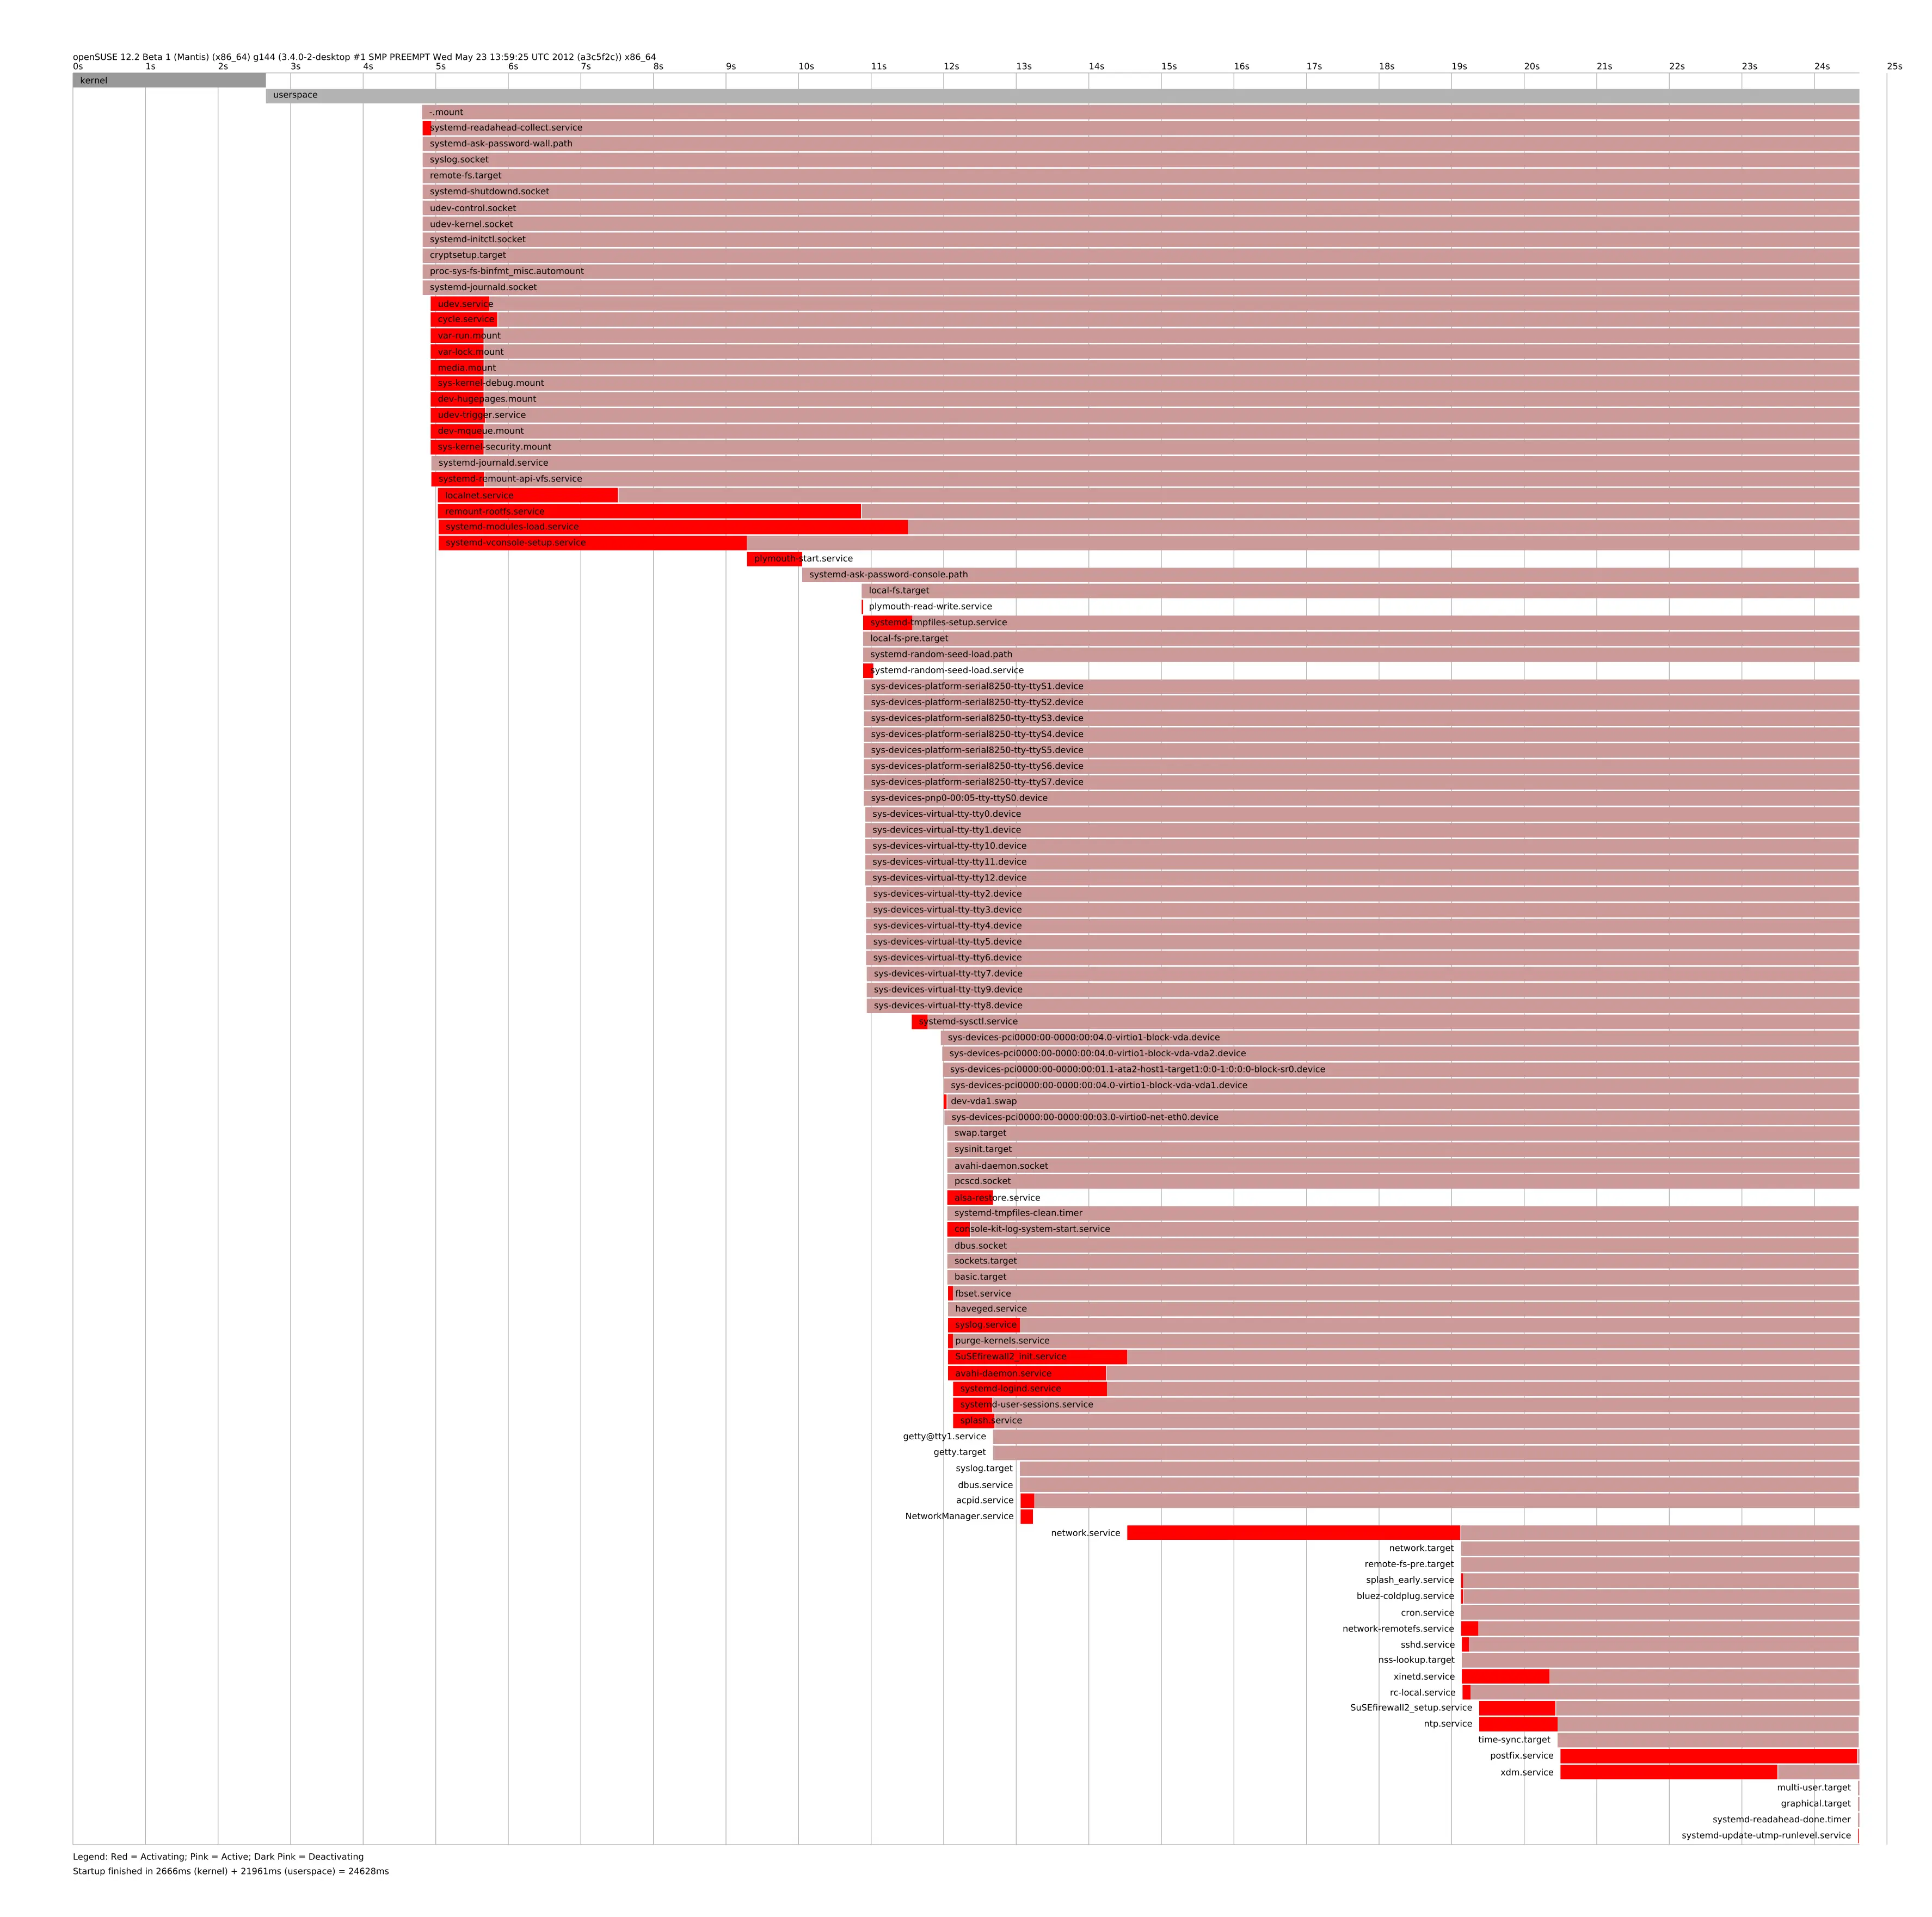
Example of a Linux boot timeline
This diagram clearly illustrates the parallelism of systemd. A service shown at the top of systemd-analyze blame may appear slow, but the diagram reveals that other components were running alongside it the entire time, and it hardly delayed the overall boot process at all. The opposite situation can also be immediately apparent: units that are short on their own may form a long chain of dependencies, where the next one starts only after the previous one has finished.
On a server running Docker, PostgreSQL, Nginx, monitoring and backup systems, and custom systemd units, this visualization is particularly useful, since several dozen lines of terminal output are condensed into a single timeline, making it much easier to identify suspicious sections.
A real-world snippet of boot.svg with a highlighted long unit or dependency chain works well here. In this example, the difference between the time taken by an individual service and its actual impact on boot time is visible almost immediately.
Common Causes of Slow Linux Boot Times
We’re wrapping up, and for quick troubleshooting, the entire method described above can be summarized in a small table:
| Symptom | Likely area to investigate | Where to start |
|---|---|---|
| Long userspace startup | systemd unit | systemd-analyze blame |
| Several slow units | dependencies | systemd-analyze critical-chain |
| Long network wait | wait-online, DHCP, interface | networkctl, nmcli |
| Pause of the same duration on every boot | timeout | journalctl -b |
| Problem appeared after removing a disk | /etc/fstab |
lsblk -f, findmnt --verify |
| Kernel takes a long time to load | storage, driver, device | dmesg, journalctl -b -k |
| Failed units are present | service or resource error | systemctl --failed |
| Linux has booted, but the website is still unavailable | application, database, containers | service logs, health check |
Such a table is also useful because it helps you avoid starting the diagnosis from the wrong end; after all, if userspace takes 40 seconds, it’s too early to tinker with kernel parameters. If systemd starts up instantly but PostgreSQL takes another minute to complete recovery, speeding up multi-user.target won’t solve the underlying problem at all.
How fast should a Linux server actually boot?
Unfortunately, there is no single "normal" boot time, since it’s obvious that a small VPS and a physical server with a RAID controller, multiple network interfaces, and a large set of services will boot at different speeds.
And reaching multi-user.target doesn’t always mean the server is ready for operation - after all, PostgreSQL might still be recovering from a failure, Docker might be starting containers, and your application might be performing migrations.
That’s why it’s more useful to define your own readiness point. For a web server, this might be a successful Nginx response to a health check; for a database, it might be the ability to accept connections; and for an infrastructure node, the criterion would be the availability of the necessary network services.
In essence, what is truly important is the server recovery time - the time that elapses from when the machine starts up until it is once again capable of performing its tasks.
So, optimizing the boot time of a Linux server rarely requires exotic kernel patches or the drastic removal of system components. More often than not, the culprit turns out to be something quite mundane, such as a network delay, a missing disk, an unnecessary service, an incorrect dependency, or a timeout that’s set too long.
The main tools for identifying the causes of boot delays are already built into the system. These include tools such as systemd-analyze, critical-chain, systemctl, journalctl, dmesg, lsblk, and findmnt. Together, they allow you to break down the boot process into understandable stages and understand where those precious seconds are actually being spent.
The most important thing in all of this is not to turn boot optimization into a race for the lowest possible number, since for a production Linux server, a stable 12 seconds is better than an unstable 7, and good optimization means that after a reboot the machine not only comes online faster but also predictably returns to a fully operational state every time.
FAQ: Frequently Asked Questions About Linux Boot Times
How long should a Linux system take to boot?
There is no single standard - nor can there be - since the time depends on the hardware or virtual machine, disk configuration, network, and the number of services being started. It’s much more useful to compare a specific server with its usual boot time and look for significant deviations.
Why does Linux take so long to boot?
Most often, the cause is related to waiting for a resource. This could be a disk, a network interface, DHCP, a file system, or a systemd service. The delay can also occur earlier - during kernel execution or initramfs.
Why does a 60- or 90-second pause occur every time Linux boots?
A consistent pause duration often indicates some kind of timeout. The system is waiting for something, does not receive the expected event, and continues booting only after the specified time has elapsed.
Can /etc/fstab slow down the boot process?
Yes. For example, /etc/fstab might still contain an entry for a disk that has already been disconnected. During boot, the system will attempt to locate the device and wait for it to appear for a certain amount of time.
Why doesn’t a slow systemd service always slow down the boot process?
systemd runs many services in parallel. A service may take 15 seconds to start, but at the same time, the system is busy with other tasks. Therefore, the startup time of an individual unit and its impact on the total boot time are two different things.
Is it dangerous to disable services to speed up boot?
It depends on the service. Disabling a truly unnecessary service usually doesn’t cause problems, but interfering with the operation of the network, file systems, SSH, or virtualization components can lead to failures after a reboot. First, you need to determine the purpose of the service and its dependencies.