When a VPS starts running slower than usual, many administrators follow the usual routine: they connect via SSH, open top or htop, check memory usage with free -m, and verify disk space with the df -h command. Yes, this approach helps you understand what’s happening with the server right now.
But there’s one problem. If a traffic spike occurred ten minutes ago and had already subsided by the time of the check, you won’t always be able to see any traces of it. The server looks healthy again, and the cause of the slowdown remains unknown.
The need for server monitoring becomes obvious, and while monitoring used to be set up mainly for large projects with highly complex infrastructure, this issue is now relevant for individual servers as well, especially those acting as hypervisors, such as for Docker containers. It’s always useful, even on a small VPS, to have access to historical data on CPU, memory, disk, and network usage. Otherwise, many issues have to be investigated practically blind.
And, it would seem, our blog already had an article on VPS monitoring. But there’s one caveat here, and it lies in the relative complexity of modern monitoring solutions. For example, popular systems like Prometheus, Grafana, or Zabbix offer huge capabilities, but they come at the cost of your time, since you have to deal with configuration, metric storage, notifications, dashboards, and so on. Plus, sometimes you need to dedicate a separate server for monitoring.
And as you can imagine, for a small project, this approach is clearly overkill.
It is precisely in such cases that Netdata appears to be a rather practical solution, since its installation takes only a few minutes, after which the system immediately begins collecting hundreds of metrics and displaying them in a user-friendly web interface in near real time. And all of this is lightweight enough to run even on the simplest server without consuming many resources.
What is Netdata
Netdata is an open-source monitoring system designed to analyze the status of servers, virtual machines, containers, and applications in real time.
After installation, it automatically detects most system components and begins collecting data without the need to manually create dashboards, configure exporters, or write metric collection rules. In fact, Netdata turns a VPS into a transparent system where you can see virtually everything happening on the server through a single web interface. Instead of dozens of console commands, the administrator gets a set of interactive graphs that allow them to quickly identify the source of a problem.
The main difference between Netdata and many other monitoring platforms lies in its focus on real-time diagnostics. While Grafana and Prometheus are often used to analyze trends over months and years, Netdata helps quickly answer the question: what is happening with the server right now and what was happening a few minutes ago.
How many resources does Netdata consume?
One of the most frequently asked questions before installing any monitoring system is whether the monitoring system itself will become a source of additional load. And as we mentioned above, Netdata is considered a fairly lightweight solution.
In the case of Netdata, such concerns are usually unfounded, as the project was originally designed with the goal of continuously collecting a large number of metrics without noticeably impacting server performance. To achieve this, most of the data is processed locally, without complex queries to external databases and without the need to constantly transfer large amounts of information to a separate monitoring server.
Another reason for the low resource consumption lies in the architecture of the solution itself. Netdata retrieves metrics directly from the operating system and applications, stores most of the operational data in memory, and is optimized for real-time operation. As a result, the system does not have to perform heavy computations or constantly access the disk.
For a typical VPS, you can use the following figures as a guide:
| Resource | Typical Consumption |
|---|---|
| CPU | Less than 1-2% |
| RAM | 100-300 MB |
| Disk Space | Depends on storage settings |
| Network Traffic | Minimal |
Of course, specific figures depend on the number of metrics collected, the number of containers, databases, and other services on the server. For example, if several dozen Docker containers are running on a VPS, the load will obviously be slightly higher. But if it’s a small web server with a simple website and database, then it will be significantly lower.
Moreover, there are cases where administrators install Netdata even on virtual machines with 1-2 GB of RAM and don’t notice any impact on performance. Perhaps this is precisely why this tool is often used not only on large servers but also on small VPS instances, where every megabyte of resources counts.
What metrics can be tracked
Immediately after installation, Netdata begins collecting a large number of metrics automatically. No initial configuration is usually required, as the system automatically detects available devices, services, and applications, and then begins displaying the data in the web interface.
The set of available metrics is quite extensive and includes the following:
- CPU Load - total CPU load, distribution across cores, system and user time, I/O wait time;
- RAM Usage - used and free memory, caching, buffers, memory distribution among processes;
- Swap Activity - the amount of swap space in use and the frequency of access to it. Useful for troubleshooting RAM shortages;
- Disk read and write speeds - current load on storage devices, number of I/O operations, and disk access latency;
- Network traffic - incoming and outgoing data flow, load on network interfaces, and volume of data transferred;
- Number of connections - active TCP and UDP sessions, status of network connections, and load on the network stack;
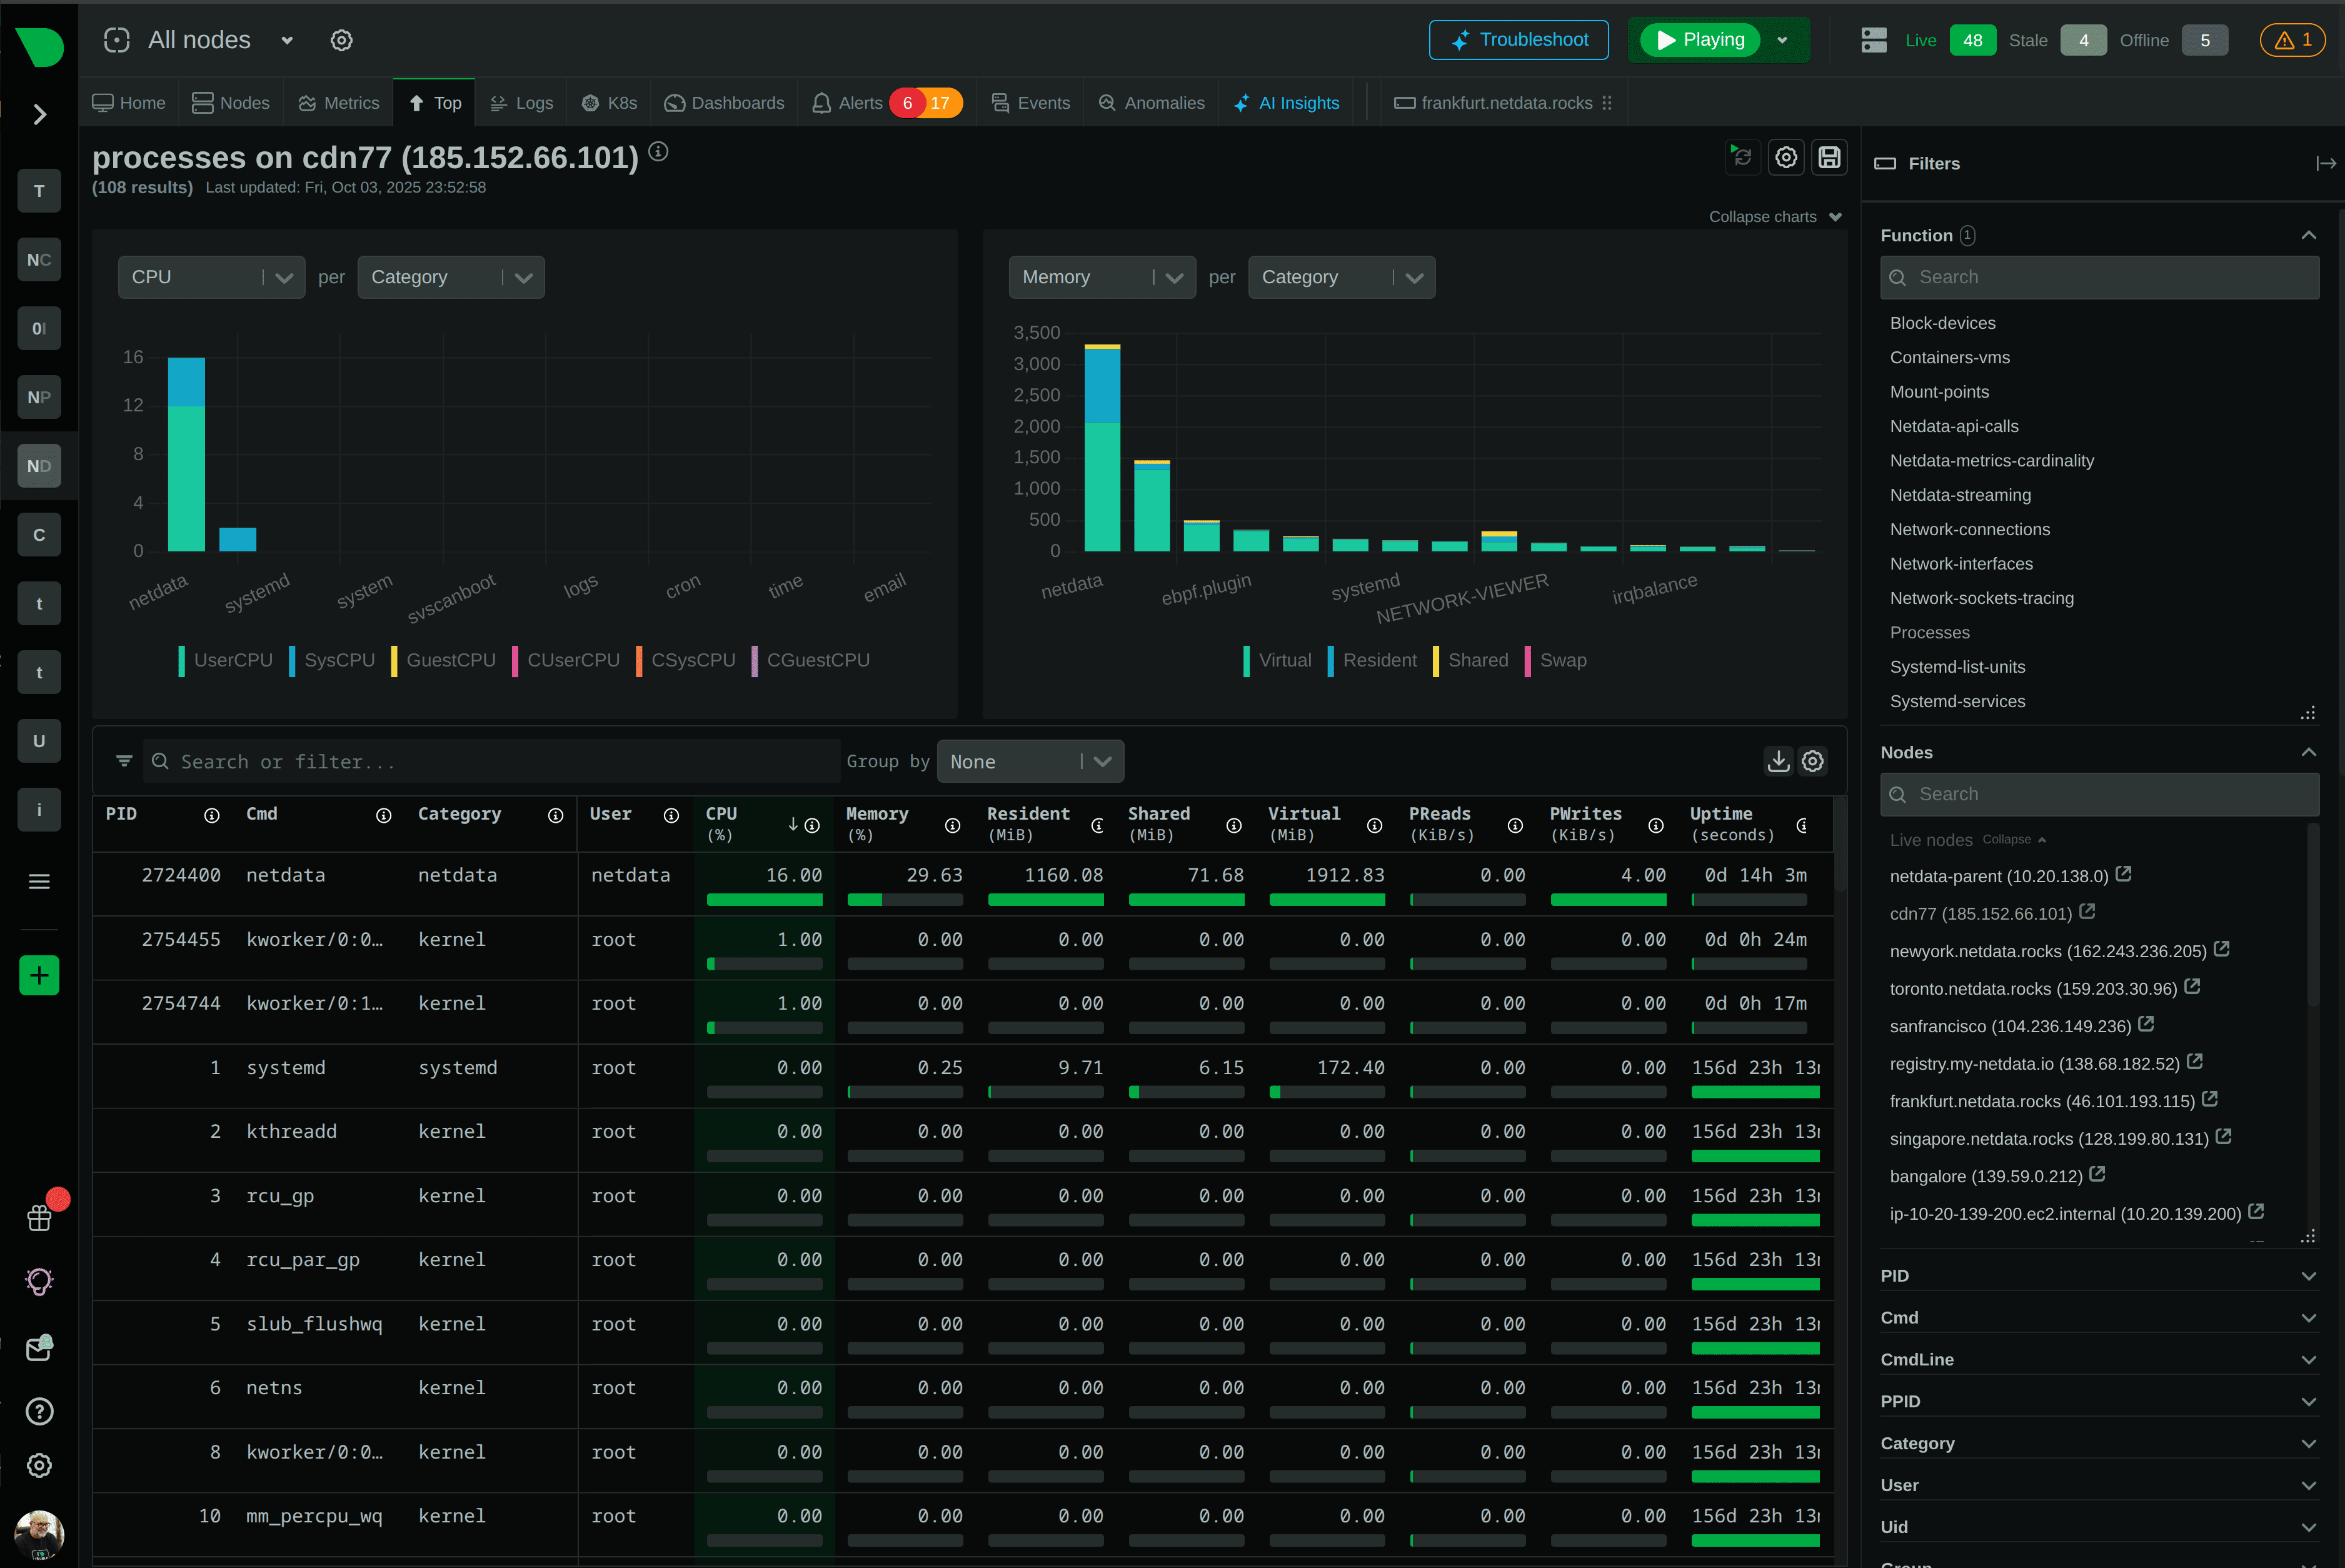
- Process activity - which applications are currently consuming CPU time and memory;
- File system usage - disk space usage by partitions and mount points;
- Docker container metrics - resource consumption by each container, network traffic, and process activity within containers;
- Web server statistics - data from Nginx, Apache, and other supported servers if the corresponding modules are available;
- Database metrics - activity of MySQL, MariaDB, PostgreSQL, Redis, and other popular DBMSs.
But the list doesn’t end there. For example, Netdata can display hardware temperature (if sensors are available to the system), RAID array statistics, the status of systemd services, virtualization data, and a vast array of other parameters.
As a result, the administrator receives not isolated figures from various utilities, but a unified view of what is happening on the server. Sometimes this is enough to find the cause of problems in a few minutes - a search that would have taken significantly longer via the console.
Installation on a Linux server
One of the reasons for Netdata’s popularity is its very simple installation process. While many monitoring systems require database setup, agent configuration, and manual dashboard creation, things are much simpler here.
For most modern Linux distributions, simply running the official installation script is sufficient:
wget -O /tmp/netdata-kickstart.sh https://get.netdata.cloud/kickstart.sh
sh /tmp/netdata-kickstart.sh
This script will automatically detect the operating system, install the necessary dependencies, download the latest version of Netdata, and register the service on the system. This process usually takes only a few minutes.
Once the installation is complete, the service starts automatically. You can check its status with the command:
systemctl status netdata
By default, the web interface is accessible on port 19999 and you can access it, for example, like this:
http://IP_СЕРВЕРА:19999
However, if there is a firewall between you and the server, you may need to open this port separately. Otherwise, the browser simply won’t be able to connect to the monitoring interface.
At this stage, many administrators make a common mistake - they simply open port 19999 to the entire internet and leave it that way. Yes, for testing and during setup, this might seem like a convenient solution, but you should never do this in a production environment!
After all, this is the server’s administrative interface, and any additional service accessible from the outside increases the attack surface. Therefore, even if there are no known security issues in Netdata itself, it is still considered good practice to restrict access to all administrative panels.
Typically, one of the following options is used:
- access only from trusted IP addresses via a firewall;
- connection via VPN;
- publishing the interface via Nginx or Apache acting as a reverse proxy;
- additional HTTP authentication before accessing the panel.
Of course, for a home server or a test virtual machine, this may seem like an excessive precaution. But for any public VPS with a public IP address, such measures are already considered basic security hygiene.
Netdata starts collecting metrics immediately after its first launch. No additional agents, manual device connections, or graph creation are required. Within seconds of opening the web interface, you can already see CPU load, memory usage, network activity, and other server metrics in real time.
Isn’t that a miracle? :)
Publishing Netdata via Nginx
If you need to use monitoring regularly, opening port 19999 directly usually doesn’t make sense. It’s much more convenient and secure to publish the interface via Nginx and use a familiar domain name.
This also eliminates the need to keep an additional port accessible from the outside. The user will interact with Netdata via standard HTTP or HTTPS, while the service itself remains accessible only locally on the server.
The simplest Nginx configuration for publishing Netdata looks like this:
location /netdata/ {
    proxy_pass http://127.0.0.1:19999/;
    proxy_set_header Host $host;
    proxy_set_header X-Real-IP $remote_addr;
}
After applying the configuration and restarting Nginx, the monitoring interface will be accessible at an address of the form:
https://example.com/netdata/
This approach offers several advantages at once. For example, the connection can be secured with an SSL certificate, existing firewall rules can be utilized, and access can be centrally managed via the web server. And if multiple administrators use the monitoring system, HTTP authentication can be enabled. In this case, Nginx will prompt for a username and password before opening the dashboard.
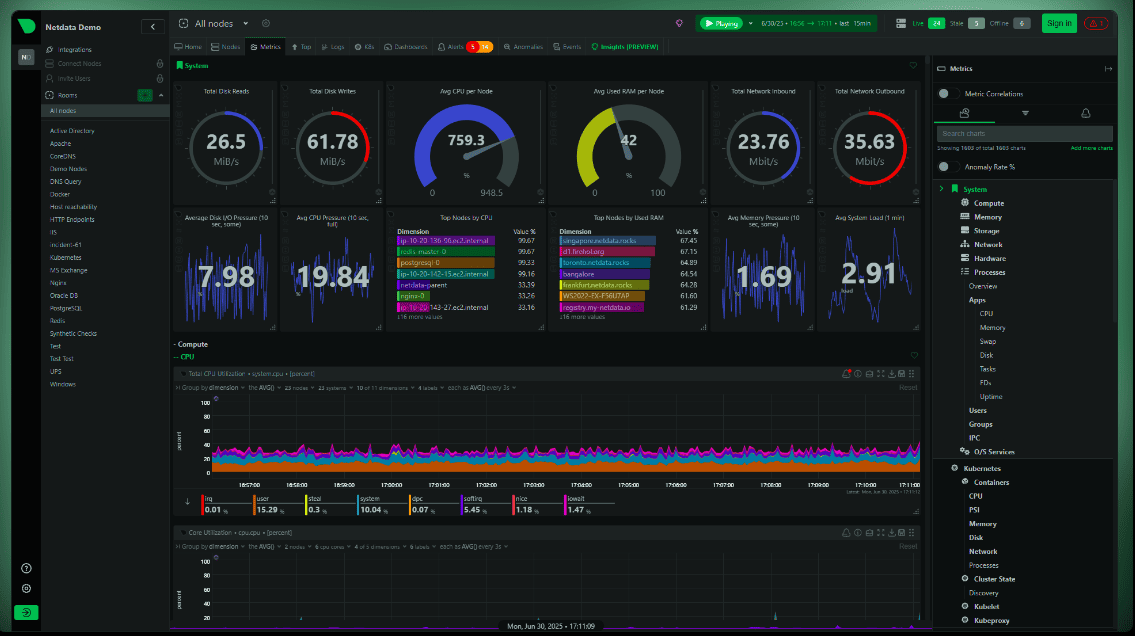
First Look at the Interface
The first time many people open Netdata, they have roughly the same reaction: too many graphs.
The screen is literally filled with charts, numbers, and metrics, which can be confusing at first, especially if your monitoring was previously limited to the top, htop commands, and viewing logs in the server console.
But after a few minutes of calm exploration, it becomes clear that there is no chaos here. The interface is grouped by categories, and the key metrics are right there on the first few screens.
Most often, administrators refer to several sections:
- CPU - overall CPU load, load distribution across cores, system and user time;
- Memory - usage of RAM, caches, buffers, and swap;
- Disk - read and write speeds, number of I/O operations, and disk latency;
- Network - network traffic, number of connections, and load on interfaces;
- Applications - metrics for individual services and applications, if Netdata was able to detect them.
You can scroll back through any graph to see what was happening a few minutes, hours, or even days ago (depending on the data storage settings). If a user reported that the site was down at 2:17 PM, you can open that time interval and see exactly what was happening on the server at that moment.
In fact, monitoring is set up precisely for situations like this. Not for pretty graphs, but for the ability to see a problem after it has already occurred.
Monitoring Docker Containers and WordPress
As we know, more and more projects today are built using Docker containers. Even a relatively simple website can consist of several separate microservices, such as web servers, databases, Redis, a task queue, and other components.
Netdata is well-suited for such infrastructure because, after installation, it automatically detects running containers and begins collecting statistics for each one separately.
The following data is available for containers:
- CPU load;
- RAM usage;
- network traffic;
- read and write operations;
- number of processes inside the container.
Consider a VPS where WordPress runs in Docker alongside MariaDB and Redis. Users start complaining about slow page loading. The server’s overall load is indeed high, but standard system metrics don’t always make it clear which specific service is causing the problem.
Netdata lets you view the load for each container separately. Sometimes it turns out that the entire problem is related to the database. In another scenario, memory consumption by the PHP-FPM container has skyrocketed. It also happens that Redis or the disk subsystem becomes the bottleneck. And all of this is clearly visible on a single, simple dashboard.
For WordPress, such scenarios are actually quite common. For example, after publishing a popular article on your site, launching an advertising campaign, or having content appear in search engine recommendations - site traffic can spike dramatically.
And it is precisely in such situations that server limitations usually begin to manifest:
- free RAM runs out;
- the load on MySQL or MariaDB increases;
- the number of PHP processes increases;
- disk load increases;
- delays occur when processing requests.
Trying to analyze such situations using a set of console utilities isn’t always convenient, especially if the problem has already disappeared by the time you connect to the server via SSH.
In Netdata, all key metrics are displayed simultaneously on a single screen. You can quickly view the load history, see which container was consuming resources at the time of the failure, and determine whether the current VPS configuration is sufficient for the existing traffic. For this reason, Netdata is often used not only for troubleshooting but also for planning the project’s future growth. When resources start to run low, this becomes apparent long before the server begins to fail users. After all, this is one of the most critical tasks of any monitoring system.
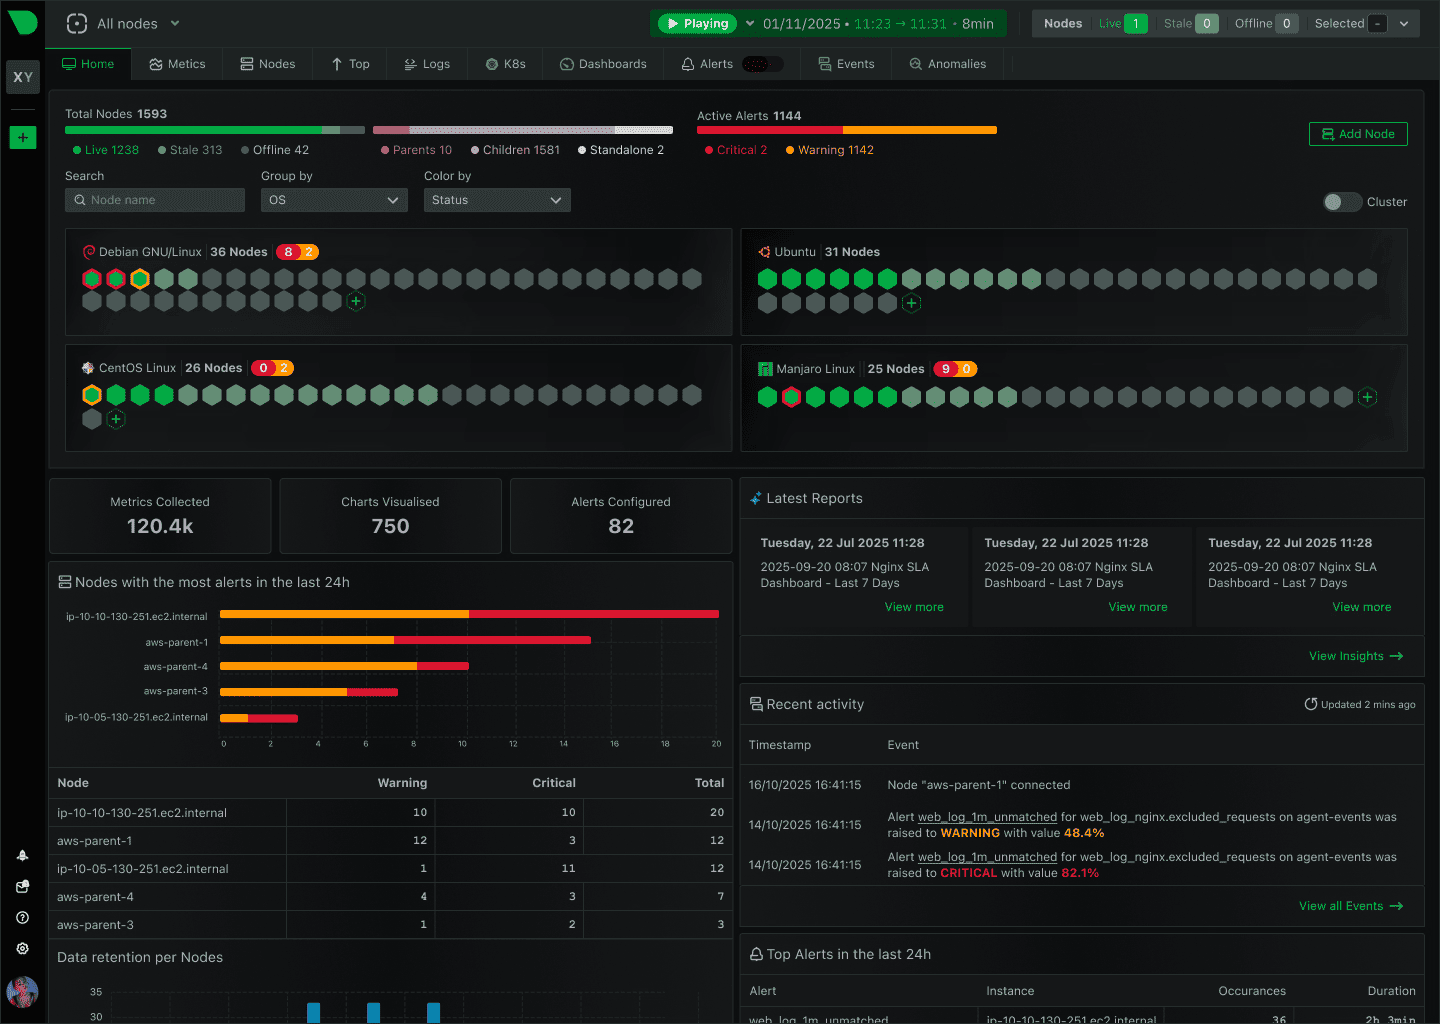
Problem Notifications
Even the most detailed monitoring is useless if the administrator notices a problem several hours after it occurs. But no one is going to keep the Netdata tab open all the time. Especially if there are multiple servers, and monitoring is used more to check the infrastructure’s status than to continuously watch the graphs.
That’s why Netdata includes an automatic notification system. The service can track various deviations from normal operation and send alerts when issues arise - for example, if a CPU is under heavy load for an extended period, the server is running out of RAM, or the file system is nearing capacity.
Several notification delivery methods are supported:
- Email;
- Telegram;
- Discord;
- Slack;
- Webhook and other integrations.
This is especially convenient for small projects that don’t have a 24/7 team of administrators. So instead of constantly checking graphs, the system notifies you of any issues that arise.
For many VPS owners, notifications are the most useful part of the monitoring system, since the graphs themselves help identify the causes of an outage, while alerts ensure you find out about it in time.
Choosing Between Netdata, Prometheus, and Zabbix
The question of which monitoring system to choose arises for almost every administrator after the first major server failure. The answer here depends not so much on the capabilities of a specific product as on the size of the infrastructure and the tasks that need to be addressed.
Below is a general, simplified comparison of popular solutions:
| Feature | Netdata | Prometheus + Grafana | Zabbix |
|---|---|---|---|
| Easy Installation | Yes | No | No |
| Quick Start | Yes | No | Partially |
| Long-Term Data Storage | Limited | Yes | Yes |
| Monitoring a Single VPS | Excellent | Overkill | Overkill |
| Kubernetes Support | Basic | Excellent | Good |
| Advanced Dashboards | Limited | Excellent | Good |
| Scaling to Dozens of Servers | Partial | Excellent | Excellent |
If the task is to monitor a single VPS, a few websites, or a small set of servers, Netdata often turns out to be the fastest way to get useful results. Installation takes just a few minutes, and graphs appear almost immediately.
With Prometheus, the situation is different. It is a powerful platform for storing and processing metrics, which performs particularly well in large infrastructures, Kubernetes clusters, and environments with dozens or hundreds of services. But along with flexibility comes complexity. You need to configure data collection, metric storage, visualization, and alerting rules.
Zabbix falls somewhere in the middle. It can do a lot, works well for corporate networks and large infrastructures, but requires significantly more time for initial implementation compared to Netdata.
There’s another point that’s rarely discussed in comparative reviews. When a server starts acting up, an administrator often needs an answer right away. Not through reports, not through complex queries to the metrics database, but literally within a few seconds. Open a page and see what was happening with the CPU, memory, or disks at the moment of the failure. And it is precisely in such situations that Netdata performs particularly well.
When Netdata Is No Longer Enough
For all its merits, Netdata remains a tool focused primarily on individual servers and real-time diagnostics.
However, if your infrastructure consists of dozens of machines, several Kubernetes clusters, and numerous microservices, and requires storing metrics for months or years, then Netdata’s capabilities may not be sufficient.
In such projects, Prometheus, Grafana, VictoriaMetrics, Zabbix, and other specialized platforms are typically used. They are better suited for centralized data collection, complex analytics, and long-term historical storage.
Interestingly, switching to a larger monitoring system doesn’t always mean abandoning Netdata. In many companies, it continues to run in parallel. Global monitoring is handled via Prometheus or Zabbix, while Netdata is used directly on the servers for quick, real-time problem analysis.
Frequently Asked Questions
Is Netdata suitable for a VPS with 1 GB of RAM?
Yes, you can install it even on such a server. However, keep in mind that the monitoring itself also consumes resources. And if a database, web server, and several applications are already running on the VPS, the additional memory consumption may be noticeable. For smoother performance, servers with 2 GB of RAM or more are usually recommended.
Can Netdata be used for free?
Yes. The basic version is sufficient for most tasks related to monitoring VPS, Docker containers, web servers, and databases. For small projects, its capabilities are usually more than enough.
Does Netdata work with Docker?
Yes. After installation, the system automatically detects running containers and begins collecting statistics for each one. Separate configuration is not required in most cases.
Can I receive notifications via Telegram?
Yes. Telegram is included in the list of supported notification delivery channels. In addition to Telegram, Email, Discord, Slack, Webhook, and other integration options are available.
How does Netdata differ from Grafana?
It’s not entirely accurate to compare these products directly, as their purposes differ somewhat. Netdata is designed for the fastest possible startup and real-time server diagnostics. Grafana, on the other hand, is more commonly used as a visualization platform for data collected by other monitoring systems, such as Prometheus.
Can Netdata be installed on Ubuntu 24.04?
Yes. Netdata works seamlessly on modern versions of Ubuntu, including Ubuntu 24.04 LTS. The official installation script automatically detects the distribution and performs the necessary steps.
Can I monitor multiple servers simultaneously?
Yes. Tools for centralized data viewing are provided for this purpose. This mode is convenient if your infrastructure includes multiple VPS instances and you need to quickly switch between them from a single interface.
Is Netdata suitable for production servers?
Yes. Netdata is actively used on production servers, including in commercial projects. Thanks to its low resource consumption, it can be installed on both small VPS instances and heavily loaded systems.
Can Netdata replace Prometheus or Zabbix?
For a single server or a small number of VPS instances, it often can. However, if centralized monitoring of a large infrastructure, long-term metric storage, and complex analytics are required, specialized platforms typically offer more capabilities. It all depends on the scale of the project and the tasks at hand.
Conclusions
So, the problem with most servers isn’t that they break down too often, but that the causes of failures usually become known only after everything is over. For example, a website was slow for a few minutes, the database suddenly spiked CPU usage, or one of the containers started consuming all available memory, and the administrator connected to the server only after the metrics had returned to normal.
Without monitoring, such situations become mere guesswork.
Netdata solves this problem in a fairly simple way. Installation takes just a few minutes, after which the server begins recording its performance history and displaying it in a user-friendly interface. You can view CPU load, memory usage, disk activity, network traffic, and the performance of containers and applications. And not just in real time, but also at the exact moment the problem occurred.
For owners of simple VPS servers, this is a useful tool not only for troubleshooting but also for predicting when a server upgrade will be needed, based on load graphs for various system components.
Of course, for large infrastructures with dozens of servers, more complex monitoring platforms are typically used. But for a single VPS, a small project, a WordPress site, an online store, or your own application server - Netdata’s capabilities are often more than enough.
Essentially, this is one of the simplest ways to start monitoring server health based on real data rather than gut feelings. And often, this approach is exactly what helps detect a problem long before it turns into a full-blown failure.